S51.5: The role of theoretical models explaining the relationships between brood parasites and their hosts
Fugo Takasu
Department of Information and Computer Sciences, Nara Women's University, Kita-Uoya Nishimachi, Nara 630-8506, Japan, e-mail takasu@ics.nara-wu.ac.jp
Takasu, F. 1999. The role of theoretical models explaining the relationships between brood parasites and their hosts. In: Adams, N.J. & Slotow, R.H. (eds) Proc. 22 Int. Ornithol. Congr., Durban: 3146-3164. Johannesburg: BirdLife South Africa.Field researches have shown that some host individuals recognise and reject parasitic eggs but the frequency of individuals that reject such eggs ranges from 0 % to 100 % depending on host population. Host populations that do not show perfect defences despite being parasitised have been a point of controversy. Do these hosts behave adaptively or do they only lack adaptive responses? I constructed mathematical models to describe the relationships between brood parasites and their hosts, and analysed how the host defence spreads under selection pressure imposed by the parasite. The main results are (1) hosts may not establish perfect defence, or (2) distribution of host defence levels is crucially affected by the parasite breeding strategy (specialised or generalised). Population dynamics is essential to these results. By measuring and estimating biological quantities (different breeding parameters), we would be able to resolve a long standing question - which hypothesis, the evolutionary lag or the equilibrium, would better explain the well studied cases of the Cuckoo Cuculus canorus and the Brown-headed Cowbird Molothrus ater. I suggest the usefulness of theoretical studies to explore problems of brood parasitism in close co-operation with empirical studies.
INTRODUCTION
Avian brood parasitism
In avian brood parasitism, female parasites lay eggs in nests of other individuals and do not take care of its own young. Accepting and taking care of the parasite eggs by a host usually reduce the host reproductive success by means of such as an increased competition among chicks in the nest or by a behaviour of the parasite chick to kill the host nest mates.
Evolution of host defenceAlthough the case of the Cuckoo Cuculus canorus is an extreme case that acceptance of parasitic egg results in a total loss of the host reproduction, acceptance of parasitism in general reduces the host reproductive success to a greater or lesser extent in most associations of brood parasites. Therefore, it is reasonable to expect that parasitism selects for some host adaptations to avoid the loss of reproduction caused by parasitism. In fact, field studies have shown that some hosts exhibit aggressive behaviour towards the parasite or have an ability to recognise the parasitic egg and reject it from the nest as a response to parasitism. These reactions are regarded to be adaptive response as defence against brood parasitism (Rothstein 1975, 1990; Davies & Brooke 1989a; Moksnes & Røskaft 1989; Brown et al. 1990; Soler & Møller 1990; Moksnes et al. 1993).
A puzzling questionRothstein (1975) documented the frequencies of nests where non-mimetic model eggs were rejected by many host species parasitised by the Brown-headed Cowbird Molothrus ater. This pioneering work showed that hosts of the Brown-headed Cowbird could be grouped into two categories, accepter or rejecter species, the former almost always accepted non-mimetic model eggs, while the latter almost always rejected them.
The lack of the defence against the cowbird parasitism seems quite puzzling because acceptance of the cowbird parasitism usually reduces the host reproductive success greatly (Rothstein 1975, 1990). To explain this puzzle, Rothstein suggested the 'evolutionary lag hypothesis' which states that accepter species accepts parasitism because they lack the genes coding for defence against parasitism. However, once it emerges, it spreads and becomes fixed (Rothstein 1975, 1990). This evolutionary lag hypothesis assumes that rejection is beneficial and would spread in the population as soon as a mutation appears.
Davies and Brooke (1989a), on the other hand, investigated the hosts parasitised by the Cuckoo and documented the frequencies of nests of different species where unlike model eggs were rejected. They showed that the rejection rate of different Cuckoo hosts were distributed continuously between 0% and 100% and that many host species showed imperfect defences. They interpreted this as an evolutionary snapshot that reflects a transient state of hosts in the process of establishing higher defence levels (Davies & Brooke 1989b). These findings have later been supported by other studies (Moksnes et al. 1990; Soler & Møller 1990; Lotem et al. 1992, 1995).
The evolutionary lag and the snapshot hypotheses are based on the non-equilibrium viewpoint that assumes that we only observe the current state in a long process of evolutionary transition. Contrary to this viewpoint, Lotem et al. (1992, 1995) suggested an equilibrium viewpoint stating that an establishment of host defence is determined by a balance of the parasitic burden and the cost to perform the defence against parasitism.
Some hypotheses other than those listed above have been proposed to explain the evolution of host defence in avian brood parasitism (Spaw & Rohwer 1987; Rohwer & Spaw 1988). However, how can we, from a comprehensive viewpoint, interpret the existence of accepter species and explain the contrasted difference in the distribution of host defence levels as shown in the cases of the Cuckoo and the Brown-headed Cowbird? To resolve this puzzling question, I adopted a theoretical approach of analysing mathematical models.
Theoretical model
In theoretical studies, we make abstractions of the essence of the target phenomenon and express them in mathematical terms that bear no ambiguity. This set of mathematical expressions is called a theoretical (or mathematical) model. By analysing the model, we obtain the correct conclusions from assumptions with mathematical reasoning (Bulmer 1994). After this comes a discussion of the model's conclusions compared with the target phenomenon and this is an indispensable task to make the model more robust and reliable. This is indispensable because mathematics itself do not necessarily reflect the actual world correctly. Sometimes the model's assumptions might turn out to be inadequate and reconstruction of the model is needed.
In this paper, by using mathematical models, I investigate (1) how the host defence is established under the parasitic pressure imposed by the parasite, (2) apply the results to the actual systems to resolve the conflicting hypotheses so far proposed, and then (3) discuss the current status of hosts in evolutionary time scale.
MODELS AND RESULTS
First, I consider and analyse a basic model in which one parasite population and one host population interacts with each other. This canonical model is aimed to correspond to an association in the field, in which a population of a specialist parasite species exclusively parasites a particular host population, such as in the case of the Cuckoo. Secondly, I extend the canonical model to involve several host populations parasitised by a generalist parasite like the Brown-headed Cowbird.
Canonical modelSuppose a simple system in which a parasitic population parasites a host population. It is assumed that no migration from outside occurs. In this case, the system considered is closed and spatially homogeneous. Host behaviour is assumed to be genetically determined and the host population consists of accepter and rejecter individuals (Rothstein 1975; Davies & Brooke 1989b, 1991; Briskie et al. 1992). Accepter individuals are assumed not to discriminate and reject parasitic eggs, and if parasitised, the reproductive success is zero. On the other hand, rejecter individuals are assumed to have an ability to recognise and reject parasitic eggs, and if parasitised, to produce fledglings. This model is called the canonical system.
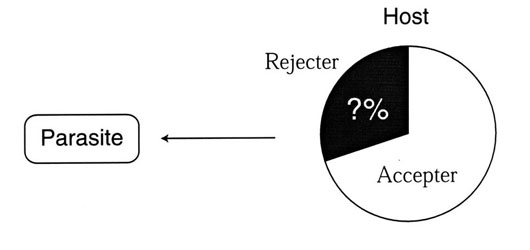
I refer to a breeding pair as an accepter pair if both the breeding individuals accept the parasitic eggs. A breeding pair is a rejecter pair if one of the individuals reject the foreign eggs. Parasitism succeeds among accepters but fails in nests of rejecter pairs. This assumption is trivial and does not change the models' results qualitatively. A schematic diagram of the canonical model is shown in Fig. 1.
The reproductive success of the accepter and rejecter pairs can be reasonably assumed to depend on the density of the parasite population denoted by P, because the probability of a host nest being parasitised is thought to increase as the parasite density P rises. However, the reproductive success of rejecter pairs decreases as the probability of being parasitised increases, because some female parasites, like the Cuckoo, remove at least one host egg when laying its own. But the reduction is small compared to the reproductive loss of accepter pairs, because rejecter pairs avoid the reproductive loss caused by the parasitic chick.
It has been suggested that host defence entails some costs to perform (May & Robinson 1985; Davies & Brooke 1988; Rohwer et al. 1989; Røskaft et al. 1990; Moksnes et al. 1991; Marchetti 1992). A rejecter individual may recognise its own egg as a parasitic one and reject it mistakenly (recognition cost). On the other hand, it may damage its own eggs when trying to reject the parasitic egg (rejection cost). To incorporate these costs, I assume that the reproductive success of rejecter pairs is less than that of accepter pairs when the level of parasitism is low (Davies et al. 1996). With these assumptions, the reproductive success of accepter and rejecter pairs is generally given as functions of the parasite density P as shown in Fig. 2. These functions are equal at a threshold parasite density denoted Pc. This threshold plays an important role in the following analysis. If we assume that there is no defence cost, rejecter and accepter pairs have the same number of offspring when P = Pc = 0.
From Fig. 2, it follows that if the parasite density P is kept larger than the threshold Pc, rejecter pairs have a higher reproductive success than accepter pairs and the rejecter individuals should increase in frequency. Even if the host population only has a small numbers of rejecter individuals, their frequency will reach 100% after a short period. On the other hand, if the parasite density is kept less than the threshold, the host population will after some generations fully consist of accepter individuals.
The parasite density P cannot, however, be kept at such a constant level, because the parasite's new-born offspring reproduces only from nests of accepter pairs. Hence the parasite population density is critically affected by the frequency of accepter pairs. Therefore, in order to investigate how the host defence is established, or how the frequency of rejecter individuals increases, we have to consider both the population dynamics of the parasite and its host.
Takasu et al. (1993) analysed the canonical model that incorporated both the parasite and host population dynamics and the population genetics. Based on Takasu et al. (1993), I outline the analysis and results heuristically without losing the essence of the model.
To begin with, suppose a situation that a parasite population parasites a host population that consists fully of accepter individuals. Because the host shows no defence against parasitism, the parasite can reproduce from all nests they parasitise. This system converges to an equilibrium state in which both the parasite and the host coexist or the parasite goes extinct, depending on the host abundance (carrying capacity) defined as the equilibrium host density in the absence of parasitism (Takasu et al. 1993). Unless the host abundance is very low, the equilibrium parasite density becomes greater than the threshold Pc.
Then, as a first step, suppose that a very small number of rejecter individuals emerge into the host population by mutation or by migration from outside populations. The parasite density is now greater than the threshold (P > Pc) and hence the rejecter individuals should increase in frequency in the host population under the strong parasitic pressure (Fig. 3 A).
As the frequency of rejecter individuals rises, however, the number of nests of accepter pairs decreases, which lowers the parasite reproductive success. The parasite population shrinks and the parasitic pressure on the host population decreases. The spreading speed of rejecter individuals slows down accordingly (Fig. 3 A).
As a second step, suppose the opposite situation where the host population is completely dominated by rejecter individuals and a small number of accepter individuals emerge by some reasons. In this case, few parasites can reproduce because most nests are of rejecter pairs and the parasite density P should be less than the threshold Pc. Because little parasitism occurs, accepter pairs have higher reproductive success than rejecter pairs and host defence is disadvantageous. The frequency of accepter individuals increases in this situation. As the frequency of accepter individuals increases, however, the parasite density recovers, which in turn decelerates the increasing spread of accepter individuals (Fig. 3 B).
By combining these two extreme situations, we expect that the system converges to an equilibrium state in which accepter and rejecter individuals coexist stable with some intermediate frequencies (Fig. 3 C).
Then, to what extent does rejecter individuals increase or what is the equilibrium frequency of rejecter individuals? This can be shown heuristically as follows; accepter (or rejecter) individuals stop to increase or decrease only when both the accepters and rejecters have the same number of offspring, i.e., when the parasite density P becomes equal to the threshold Pc.
This means that, at the equilibrium state, the frequency of rejecters in the host population allows the parasite density P to be equal to Pc. Consequently, the equilibrium frequency of rejecters rises and approaches 100% as the host abundance increases (Fig. 4). However, the equilibrium frequency of rejecter individuals cannot be 100% because the parasite population goes extinct before this state is actually realised.
This result holds true even if there is no defence cost (Pc = 0). In this case, the parasite population always goes extinct irrespective of the host abundance (Takasu et al. 1993). The host behaviour (rejection / acceptance) becomes a neutral character in the absence of parasitism. This neutral character is subject to genetic drift andeither the rejecter or the accepter individuals will eventually be fixed in the host population.
Summarising the canonical model. Rejecter individuals, if any, never come to be fixed in the host population and the equilibrium frequency of rejecters depends on the host abundance (carrying capacity). The greater the abundance, the greater the frequency of rejecters. But if the abundance is less than a certain threshold, the frequency of rejecter individuals will never increase and the host population remains an accepter population.
Generalist modelThe canonical model can be extended to incorporate N host populations, each of which labelled as host 1, host 2, ..., and host N. Assume that a parasite population utilises these N host populations without any preference and each host population consists of accepter and rejecter individuals as in the canonical model. In this system, we are interested in how rejecter individuals increase and spread and to what extent they spread in the array of N host populations (Fig. 5).
I apply the same assumptions to each host population as in the canonical model: host behaviour is genetically determined and reproductive successes of accepter and rejecter pairs are given as functions of the parasite density P as shown in Fig. 2. We now have the threshold parasite density Pci of host i, defined as the parasite density at which rejecter and accepter pairs of host i have the same reproductive success.
I assume that the threshold parasite density Pci (Pc1, Pc2, ... PcN) differs from each other because of differences in the environment and population characteristics. Without loss of generality, we rearrange the array of N host populations, so that they are labelled by the ascending order of Pci (Pc1 < Pc2 < Pc3 ... < PcN). As in the canonical model, rejecter individuals increase or decrease in frequency in the host i population depending on the parasite density P relative to the threshold Pci. In biological terms, host 1 is the most intolerant population against parasitism, where rejecter individuals increase and spread provided that the parasite density P is greater than Pc1.
First of all, I analyse this generalist model from a heuristic viewpoint, starting with a case that the system involves two host populations, host 1 and host 2 (n = 2). The analysis of this case is sufficient to grasp the essence of the general case (N > 2). For a full analysis, I refer to Takasu (1998).
First, suppose a two dimensional phase space ranging from 0% to 100%, the abscissa of which represents the frequency of rejecter individuals of host 1 and the ordinate represents that of host 2, as we are especially interested in the temporal changes of the frequencies of rejecter individuals in both populations. The frequency of rejecter individuals is relevant to the proportion of host nests unavailable for the parasite reproduction, because the parasite can reproduce only from nests of accepter pairs. Then, if we fix both the frequencies of rejecters of host 1 and host 2 to be zero, the parasite can reproduce enough from all the parasitised nests and we expect the parasite density P to be well above Pc2 (Pc1 < Pc2 < P). This situation corresponds to the point (0%, 0%) in the phase space where all the individuals of host 1 and host 2 accepts parasitism.
Contrary, if we fix both the frequencies to be 100%, i.e., (100%, 100%) point in the phase space, all the host nests are of rejecter pairs and the parasite cannot reproduce at all. In this case, we expect the parasite density to decline to zero (P = 0 < Pc1 < Pc2), because all the parasite's eggs are rejected and no recruitment is expected.
Combining these two extreme cases, the parasite density P as a function of the frequencies of rejecter individuals of host 1 and host 2 (being fixed for the moment) is given as a surface shown in Fig. 6 A, changing its value from zero around (100%, 100%) to a value greater than Pc2 around (0%, 0%) in the phase space. From this figure, we obtain the phase diagram projected onto the phase space that has three regions, (1) Pc1 < Pc2 < P, (2), Pc1 < P < Pc2, (3) P < Pc1 < Pc2, each of which is partitioned by two contour curves P = Pc1 and P = Pc2 (Fig. 6 B).
Now recall that rejecter individuals of host i increase or decrease in frequency depending on whether the parasite density P is greater or less than the threshold Pci, respectively. Then we expect that in region (1) rejecter individuals increase in frequency both in host 1 and host 2 populations. In region (2), rejecters increase in frequency in host 1 but decrease in frequency in host 2. In region (3), rejecters decrease in frequency both in host 1 and host 2. The arrows shown in Fig. 6 B indicate the directions of the temporal change of the rejecter frequencies. By tracing the direction flows, it is shown that starting from any initial state inside the phase space, the system converges to a globally stable equilibrium (Takasu 1998). In this case, the system converges to an equilibrium shown by a closed circle in Fig. 6 B, where host 1 consists fully of rejecter individuals, but rejecter and accepter individuals coexist in host 2. The equilibrium parasite density is equal to Pc2. This equilibrium state is globally stable and even if disturbed by some exogenous reasons such as immigration of accepter or rejecter individuals, it tends to return to the original equilibrium.
We have heuristically derived that the system converges to an equilibrium state shown in the phase diagram. The phase diagram, however, looks different from that shown in Fig. 6, and the system can converge to a different equilibrium state depending on the abundances (carrying capacities) of the two host populations. This is because the amount of host nests available for the parasite's reproduction depends not only on the frequency of rejecter individuals, but also on the host density that is limited by the carrying capacity.
Suppose, for example, that the abundance of host 1 is considerably lower than that of host 2 (Fig. 7). Then, the amount of nests available for the parasite reproduction is less affected by the frequency of host 1 rejecters than that of host 2, because host 1 population as a resource for the parasite reproduction is small. Thus, two contour curves (P = Pc1 and P = Pc2) cross the phase space more horizontally (Fig. 7). On the other hand, when the abundance of host 2 is lower than that of host 1, the frequency of host 2 rejecters does not affect the parasite reproduction as much, so that two contour curves run the phase space in more upright positions (Fig. 7).
Irrespective of the values of host abundance, however, we expect three regions at most in the phase space, each of which is partitioned by two contour curves as shown in Fig. 7. By tracing the direction flows in each region, it is shown that the system, starting from any initial state inside the phase space, converges to a globally stable equilibrium shown by closed circles in Fig. 7 (Takasu 1998).
Although an equilibrium state is realised depending on the abundances of host 1 and host 2, the equilibrium comes to lie on the line segments shown in Fig. 8 A, irrespective of what the abundances are. In other words, the following two qualitatively different equilibria are possible; (1) rejecters and accepters coexist stable in host 1, but host 2 consists only of accepter individuals. (2) Rejecters are fixed in host 1, but rejecters and accepters coexist in host 2. In terms of the host defence level against parasitism, it could be said that host 1 establishes the defence at a higher level than host 2 at the equilibrium (host 2 < host 1) and this is just the reversed order of Pc1< Pc2.
I have heuristically analysed the generalist model with two host populations (n = 2). The same method can be applied to the general case that involves more than 3 host populations. For example, for the case of n = 3, the equilibrium state comes to lie on the line segments shown in the three dimensional phase space shown in Fig. 8 B. Host 1 establishes the defence at the highest level, host 2 at the next, and host 3 at the lowest, whatever the abundances of the three host populations. The order of the equilibrium defence level is Host 3 < Host 2 < Host 1, and this is the reversed order of three thresholds, Pc1 < Pc2 < Pc3.
In the same way, it can be shown that the system has a globally stable equilibrium that depends on the host abundances. Irrespective of the abundances, however, the defence level, or the equilibrium frequency of rejecter individuals, is realised in the order of host 1 ³ host 2 ³ host 3 ³, ..., ³ host N, which exactly matches the reversed order of the threshold parasite densities Pci, a measure of host intolerance against parasitism.
To summarise the results of the generalist model analysis: All the N host populations establish either none (0%) or perfect (100%) defence, except for one population that exhibits an intermediate defence level (between 0% and 100%). In general, host populations that have smaller threshold Pci establish the defence at higher levels. Which population will show a mixture of accepter and rejecter individuals depends on the whole set of the values of the host abundances. Fig. 9 illustrates this conclusion schematically.
DISCUSSION
Imperfect defence can be an equilibrium
The model analysis has shown that in the canonical system where a parasite population and a host population interact with each other, host rejecter individuals, if any, do not increase to be fixed in the population. As the host's abundance increases, the equilibrium frequency of rejecter individuals approaches, but never reach, 100%. This is because the parasitic pressure that selects for rejecter individuals decreases as the frequency of rejecters increases, and soon comes to be balanced with the host's defence cost. It is worth to note that even if the defence cost is zero, the rejecter frequency might not spread up to 100%. The understanding of population dynamics of both parasites and hosts is crucial for this result.
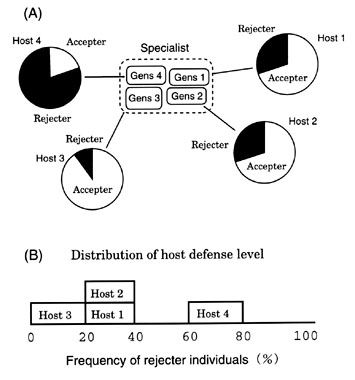
It has been suggested that the population of the Cuckoo is subdivided into several sub populations called gentes (single: gens), each of which is specialised on a particular target host (Wyllie 1981, Brooke & Davies 1988). Although recent studies have shown that the Cuckoo is a more generalistic species than it is usually thought to be (Moksnes & Røskaft 1995), it seems that the cuckoo gens is generally specialised on a particular host species and stands independent with each other.
Then, it follows that the Cuckoo and its hosts constitute a system that comprises several sets of the canonical system with one Cuckoo gens and the corresponding host (Fig. 10). In each subsystem, accepter and rejecter individuals come to coexist with a certain frequency between 0% and 100% depending on the host carrying capacity. Therefore, by superimposing these subsystems, we expect that the distribution of the frequency of rejecters exhibits a continuous spectrum as a whole system, the rejecter frequencies ranging from 0% to almost 100% depending on the abundance of each host population (Fig. 10).
Davies and Brooke (1989a) have demonstrated that the Cuckoo's hosts show various levels of the defence. They interpreted this continuous distribution of the defence standing on the non-equilibrium viewpoint and proposed the evolutionary snapshot hypothesis (Davies & Brooke 1989b). However, the equilibrium viewpoint that the Cuckoo association has come to reach an equilibrium state might be more appropriate for the following reason. In the canonical model, the probability of a host nest being parasitised is assumed positively linked with the parasite population density, and the time taken for the rejecter mutant to spread is less than several hundreds years (Takasu et al. 1993). On the other hand it takes more than several thousands years for a rejecter mutant to spread in the calculation of Davies and Brooke (1989b) where the parasitism rate was assumed to be constant. It seems unlikely that the parasitism rate remains constant while rejecter individuals are increasing in frequency. Therefore, I suggest that most associations of the Cuckoo and its hosts have nearly reached an equilibrium state unless dynamic changes in the parasitism rate or the population densities are actually observed.
Existence of accepter species: Time lag or Equilibrium?
Rothstein (1975, 1990) proposed the 'evolutionary lag' hypothesis that accepter species lack some genetic variation coding the defence against parasitism and it awaits the genetic variation to appear. Absence of the genetic variation is the most parsimonious explanation. However, more detailed explanations should be pursued before employing the evolutionary lag hypothesis.
The model analysis here has shown that host populations parasitised by a generalist parasite establish either no or perfect defence at a stable equilibrium except for one population exhibiting an intermediate defence level. Based on the model analysis, I suggest the following possibilities that could be tested and examined by field researches.
In the lag view, in which lack of rejection is simply lack of genetic variation, we should not find any significant relationships between the defence levels and the threshold parasite density Pci or the host abundance, because it is unlikely that genetic variation appears in relation to the threshold. By contrast, in the equilibrium view, we should find some correlations between the defence levels and the threshold Pci or the host abundances: host populations should be arranged in the ascending order of Pci (i = 1...N). Some indications support the equilibrium viewpoint. Rohwer and Spaw (1988) and Rothstein (1975, 1990) showed that rejecter species tend to be larger in body size than accepter species. If body size is negatively correlated with defence cost, rejecter species might have a smaller threshold Pci and hence the observed distribution of defence levels might reflect that the association has reached an equilibrium state.
The Brown-headed Cowbird expanded its range in North America during the last 160 years or so (May & Robinson 1985) and many of the host species do not have a long history of interaction with the cowbird. Thus, the lag hypothesis might well apply to some accepter species. However, if we could find some regularities in the defence levels, the threshold Pci and the host abundances, the equilibrium view would be appropriate to explain these accepter populations.
Quantitative estimations of host defence cost and abundances are insufficient to make a final conclusion and needed to test which viewpoint, evolutionary lag or equilibrium, better explains the associations of the Brown-headed Cowbird.
Effect of the Parasite Breeding Strategy - Specialist or Generalist
It has been a puzzling question that hosts of the Cuckoo exhibits continuous distribution of the defence levels, while those of the Brown-headed Cowbird show bimodal distribution of either none or perfect defences. This contrasted difference the Cuckoo and the cowbird hosts show has been explained by the difference in the spreading speed of rejecter individuals, i.e., the Cuckoo's hosts are slowly establishing the defence under weak parasitic pressure (Davies & Brooke 1989b). The cowbird hosts, on the other hand, establish the defence within a short period under strong parasitic pressure (Rothstein 1975, 1990).
From the model analysis, however, I suggest that another interpretation is possible to explain the contrasted difference. If we assume that the system has reached some equilibrium state, the contrasted difference can be attributed to the difference in the parasite breeding strategy, specialised or generalised. Here I suggest an idea that the Cuckoo's breeding strategy as a specialist brings about the continuous distribution of the host defence levels, while the cowbird's strategy as a generalist causes the bimodal distribution of the defence levels.
The Cuckoo and the Brown-headed Cowbird are among the best-studied brood parasites, but detailed information is rather limited as to the associations of the other brood parasites. Studying such parasitic systems with respect to the host defence levels in connection with the parasite breeding strategy is needed. This will test the idea that the distribution of the host defence level will be continuous in associations of specialist parasites while it will be bimodal in those of generalist parasites.
The role of theoretical model
In this paper, I constructed mathematical models and analysed the models' behaviour. Needles to say, the results obtained here are valid and correct provided the models' assumptions hold true. Although I believe that these assumptions are appropriate enough to be applied to many associations of avian brood parasitism, test of the assumptions should be made thoroughly. In this sense, models analysed here might seem too simple to be useful from the eyes of severe field biologists. A critical point is, however, that building complex models with many variables and parameters to comply with the real world does not necessarily produce good results. Complicated models involve parameters not yet estimated and hence often fail to give biologically meaningful suggestions. Good models are simple, but grasp and reflect the essence of the target phenomenon. With close communication and feedback from empirical studies, some theoretical studies advance to help us to understand the mechanisms underlying the target phenomenon. I believe that, with empirical studies together with theoretical ones, we can better explore problems of avian brood parasitism, with a hope that this paper will be a step to achieve our goal.
Extension of the modelsThe canonical model and the generalist model analysed here are simple and they ignore some complexity of the real world, which might affect the results greatly. Here I will discuss the possible extension of the models to derive more general conclusions.
Spatial structure
In this paper, all the events are assumed to occur within a closed homogeneous system and no spatial structure is taken into account. In fact, however, the distribution ranges of parasite and host population in the field are not homogeneous and they are not necessarily overlapping with each other. If there is an area free of parasitism outside the parasite distribution range, it could form a source population from which accepter individuals migrate into heavily parasitised areas. A model incorporating spatial structure can exhibit complex phases of dynamics (Comins et al. 1992). Extension of the present models to involve spatial structure is needed as a next step of a theoretical study of avian brood parasitism.
Inheritance of host behaviour
In this paper, I assumed that host behaviour is genetically determined and a host individual is assumed to behave as either accepter or rejecter throughout its lifetime. Recent field studies, however, have shown that some hosts have behavioural plasticity to change their behaviour toward parasitism according to the past experience such as detecting a parasite near their nest (Brooke et al. 1998). The results obtained in this paper that rejecter and accepter individuals come to coexist, however, might not change qualitatively even if this behavioural plasticity is taken into account. The argument holds true as long as we stand on an adaptive viewpoint that the host rejects parasitism because it is more adaptive and that rejection is disadvantageous when parasitism rate is low. Therefore, it could be concluded that the results of the model analyses are robust and remain unchanged qualitatively even if we postulate behavioural plasticity of host actions towards parasitism instead of genetic inheritance.
ACKNOWLEDGEMENTS
I thank N. Davies, A. Lindholm, E. Røskaft, and M. Soler for fruitful discussions and work on this project on avian brood parasitism. This work was supported in part by Japan Ministry of Education, Grant-in-Aid for Scientific Research Fund, Science and Culture (08740600).
REFERENCES
Briskie, J. V., Sealy, S. G., & Hobson, K. A. 1992. Behavioral defences against avian brood parasitism in sympatric and allopatric host populations. Evolution 46: 334-340.
Brooke, M. de L., & Davies, N. B. 1988. Egg mimicry by Cuckoos Cuculus canorus in relation to discrimination by hosts. Nature, London 335: 630-632.
Brooke, M. de L., Davies, N. B., & Noble, D. G. in press. Rapid decline of host defences in response to reduced cuckoo parasitism: behavioral flexibility of reed warblers in a changing world. Proceedings of Royal Society of London, B.
Brown, R. J., Brown, M. N., Brooke, M. de L., & Davies, N. B. 1990. Reactions of parasitized and unparasitized populations of Acrocephalus warblers to model Cuckoo eggs. Ibis 132: 109-111.
Bulmer, M. 1994. Theoretical Evolutionary Ecology. Massachusetts; Sinauer: 6 pp.
Comins, H.N., Hassel, M. P., & May, R. M. 1992. The spatial dynamics of host-parasitoid systems. Journal of Animal Ecology 61: 735-748.
Davies, N. B., & Brooke, M. de L. 1988. Cuckoos versus Reed Warblers: adaptations and counteradaptations. Animal Behaviour 36: 262-284.
Davies, N. B., & Brooke, M. de L. 1989a. An experimental study of co-evolution between the Cuckoo, Cuculus canorus, and its hosts: I. Host egg discrimination. Journal of Animal Ecology 58: 207-224.
Davies, N. B., & Brooke, M. de L. 1989b. An experimental study of co-evolution between the Cuckoo, Cuculus canorus, and its hosts: II. Host egg markings, chick discrimination and general discussion. Journal of Animal Ecology 58: 225-236.
Davies, N. B., & Brooke, M. de L. 1991. Coevolution of the Cuckoo and its hosts. Scientific American (January) 264:66-73.
Davies, N. B., Brooke, M. de L., & Kacelnik, A. 1996. Recognition errors and probability of parasitism determine whether Reed Warblers should accept or reject mimetic Cuckoo eggs. Proceedings of Royal Society of London. B. 263: 925-931.
Lotem, A., Nakamura, H., & Zahavi, A. 1992. Rejection of Cuckoo eggs in relation to host age: a possible evolutionary equilibrium. Behavioural Ecology 3: 128-132.
Lotem, A., Nakamura, H., & Zahavi, A. 1995. Constrains on egg discrimination and Cuckoo-host coevolution. Animal Behaviour 49: 1185-1209.
Marchetti, K. 1992. Costs to host defence and the persistence of parasitic cuckoos. Proceedings of the Royal Society London, B 248: 41-45.
May, R. M., & Robinson, S. K. 1985. Population dynamics of avian brood parasitism. American Naturalist 126: 475-494.
Moksnes, A., & Røskaft, E. 1989. Adaptation of Meadow Pipits to parasitism by the Cuckoo. Behavioural Ecology and Sociobiology 24: 25-30.
Moksnes, A. & Røskaft, E. 1995. Egg-morphs and host preference in the Common Cuckoo (Cuculus canorus): an analysis of Cuckoo and host eggs from European museum collections. Journal of Zoology, London 236: 625-648.
Moksnes, A., Røskaft, E., Braa, A. T., Korsnes, L., Lampe, H. M., & Pedersen, H. C. 1990. Behavioural responses of potential hosts towards artificial Cuckoo eggs and dummies. Behaviour 116: 64-89.
Moksnes, A., Røskaft, E., & Braa, A. T. 1991. Rejection behaviour by Common Cuckoo hosts towards artificial brood parasite eggs. Auk 108: 348-354.
Moksnes, A., Røskaft, E., & Korsnes, L. 1993. Rejection of Cuckoo (Cuculus canorus) eggs by Meadow Pipits (Anthus pratensis). Behavioural Ecology 4: 120-127.
Rohwer, S., & Spaw, C. D. 1988. Evolutionary lag versus bill-size constraints: a comparative study of the acceptance of cowbird eggs by old hosts. Evolutionary Ecology 2: 27-36.
Rohwer, S., Spaw, C. D., & Røskaft, E. 1989. Costs to Northern Orioles of puncture-ejecting parasitic cowbird eggs from their nests. Auk 106: 734-738.
Røskaft, E., Orians, G. H., & Beletsky, L. D. 1990. Why do Red-winged Blackbirds accept eggs of Brown-headed Cowbirds? Evolutionary Ecology 4: 35-42.
Rothstein, S. 1975. Evolutionary rates and host defences against avian brood parasitism. American Naturalist 109: 161-176.
Rothstein, S. 1990. A model system of coevolution: avian brood parasitism. Annual Review of Ecology and Systematics 21: 481-508.
Soler, M., & Møller, A. P. 1990. Duration of sympatry and coevolution between the Great Spotted Cuckoo and its Magpie host. Nature, London 343: 748-750.
Spaw, C. D., & Rohwer, S. 1987. A comparative study of eggshell thickness in cowbirds and other passerines. Condor 89: 307-318.
Takasu, F. 1998. Why do all host species not show defence against avian brood parasitism: evolutionary lag or equilibrium? American Naturalist 151: 193-205.
Takasu, F., Kawasaki, K., Nakamura, H., Cohen, J. E., & Shigesada, N. 1993. Modelling the population dynamics of a cuckoo-host association and the evolution of host defences. American Naturalist 142: 819-839.
Wyllie, I. 1981. The Cuckoo. Batsford, London.
Fig. 1 Schematic diagram of the canonical model. A parasite population exploits a host population which consists of rejecter and accepter individuals. Our goal is to analyse to what extent the rejecter individuals, if any, spread in the host population.

Fig. 2 Reproductive success of rejecter and accepter pairs as functions of the parasite density P. Host defence is advantageous only when the parasite density P exceeds the threshold density Pc due to the cost needed to perform the defence.
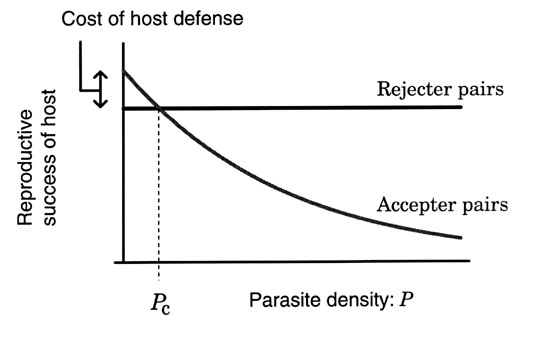
Fig. 3. Graphical analysis of the spreading of rejecter individuals. (A) When the frequency of rejecter individuals is low, the parasite density P is greater than Pc and hence rejecters increase in frequency in the host population. (B) When the frequency of rejecters is high, the parasite reproductive success is very low (P < Pc) and host defence is disadvantageous due to the cost of keeping the rejection behaviour. (C) Rejecters and accepters coexist in the host population as an equilibrium state. The parasite density P is equal to Pc.
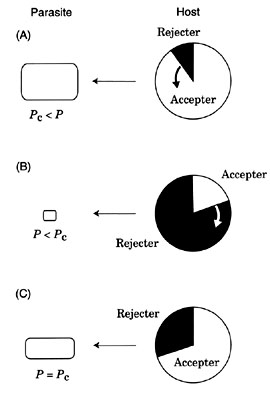
Fig. 4. The equilibrium frequency of rejecter individuals depends on the host abundance (carrying capacity). A larger host abundance allows a greater equilibrium frequency, and it approaches 100% but will never be fixed. Rejecter individuals never spread if the abundance is less than a certain threshold.
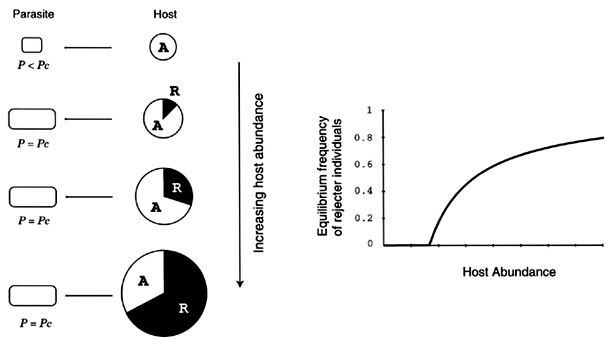
Fig. 5. Schematic diagram of the generalist model in case of n = 4. Our goal is to analyse to what extent the rejecter individuals spread in the array of N host populations under a parasitic pressure imposed by the parasite.
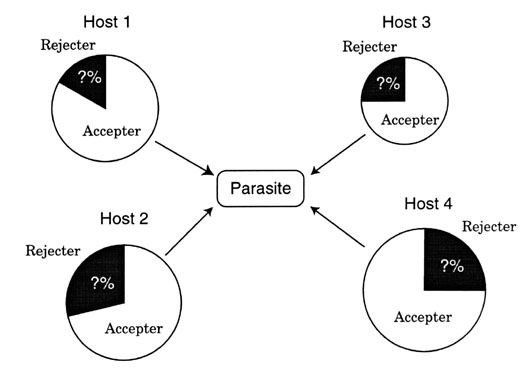
Fig. 6. (A) The parasite density P as a function of the frequencies of rejecter individuals in host 1 and host 2 populations. (B) Phase diagram obtained from (A). There are three regions partitioned by two contour curves P = Pc1 and P = Pc2. Arrows indicate the direction of flow of frequencies of rejecters. Closed and hatched circles represent globally stable and unstable equilibria, respectively.
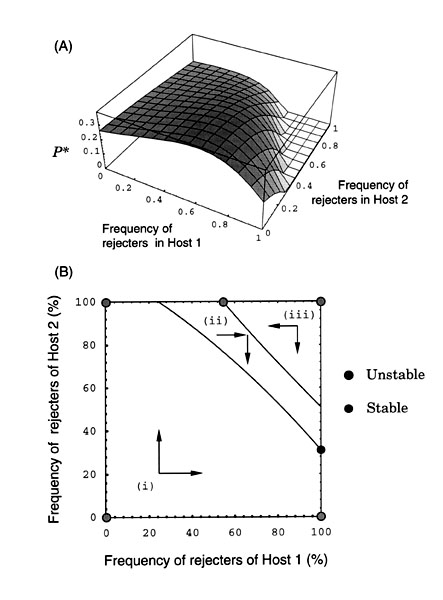
Fig. 7. Dependency of the phase diagram on the host abundances. As host 1 becomes less abundant, two contour curves lie more horizontal in the phase diagram. On the other hand, two curves run more upright as host 2 becomes less abundant. Closed circles represent the globally stable equilibrium to which the system converges.
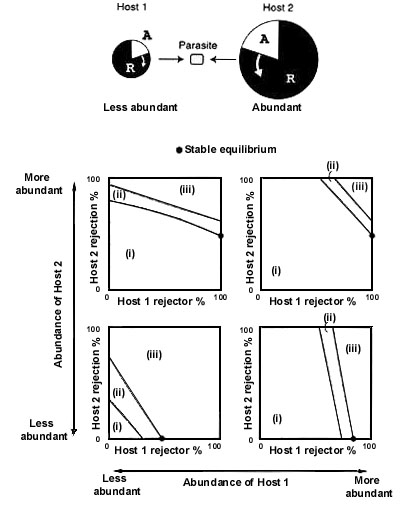
Fig. 8. Distribution of stable equilibrium points projected in the phase diagram. Irrespective of the host abundances, the globally stable equilibrium lies on the line segments shown in shaded lines. (A) n = 2, (B) n = 3.
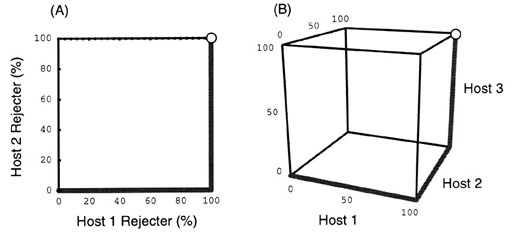
Fig. 9. Example of equilibrium distribution of host defence levels when the parasite exploits six host populations (n = 6). Here, host 4 exhibits a mixture of rejecter and accepter individuals. Which host exhibits such a dimorphism, however, depends on the whole set of abundances of the six host populations.
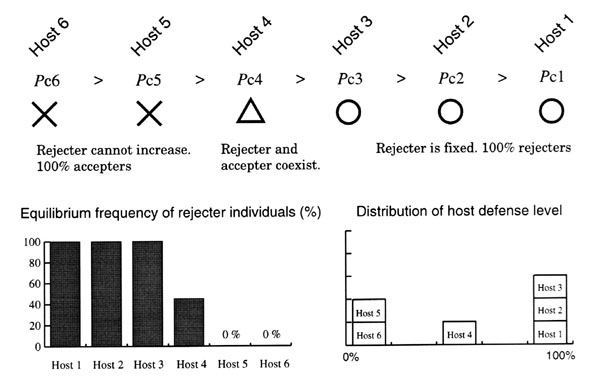
Fig. 10. (A) Diagram showing the cuckoo population with four gentes, each of which parasites a particular host population. In each canonical system, the host shows a mixture of rejecter and accepter individuals as equilibrium state which depends on each host's abundance. (B) Distribution of host defence levels. Unless all the host populations are identical, we expect various degrees of defence levels as an equilibrium state.
