S43.5: Spatial scale and the structure of a forest bird community in Panama
W. Douglas Robinson1, Tara R. Robinson2, Jeffrey D. Brawn3, John Terborg4, & Scott K. Robinson5
1,2Department of Zoology and Wildlife Science, 331 Funchess Hall, Auburn University, Auburn, Alabama, 36849 5414, USA, e-mail songwren@pop.life.uiuc.edu; 3Illinois Natural History Survey, 607 E. Peabody Dr., Champaign, Illinois, 61820, USA, e-mail j-brawn@uiuc.edu; 4Center for Tropical Conservation, Duke University, 3705 Erwin Road, Durham, North Carolina, 27705, USA; 5Illinois Natural History Survey, 607 E. Peabody Dr., Champaign, Illinois, 61820, USA.
Robinson, W.D., Robinson, T.R., Brawn, J.D., Terborgh, J. & Robinson, S.K. 1999. Spatial scale and the structure of a forest bird community in Panama. In: Adams, N.J. & Slotow, R.H. (eds) Proc. 22 Int. Ornithol. Congr., Durban: 2591-2606. Johannesburg: BirdLife South Africa.Efforts to compare Neotropical bird communities have focused on Amazonian and Central American communities, but have been hampered by differences in census methodology, including spatial scale. We reconciled these differences by employing the same suite of census methods used in an earlier Amazonian study and expanding the spatial scale of sampling at the Limbo site in Panama from the original 2 ha to 100 ha. Compared with the Amazonian community, Limbo was distinctly less dominated by rare species. Whereas 35% of species in the Amazonian site were present in densities of < 1 pair/100 ha, only 22% were comparably rare in Panama. Further, although the Panama community hosted nearly twice as many individuals, total biomass density was similar in the two communities. Two factors reducing the effectiveness of small plots for measuring bird abundances were large average territory sizes (median = 6 ha in Panama) and patchy spatial distributions for nearly all species. Our results indicate: 1) a large spatial scale is required to estimate adequately the abundances of a majority of the species in lowland tropical forests; and 2) the Panama community differs substantially from the Amazonian community. Thus, results from Amazonia cannot be generalized to all lowland Neotropical forest bird communities. We offer several hypotheses to explain the geographic differences in community structure, most of which are based on differing biogeographic histories of the two sites.
INTRODUCTION
The general paucity of data from the Neotropics has prompted debate over issues such as population densities, community biomass distribution, territory sizes, and patterns of seasonal movements in forest bird communities (Karr 1971; Karr & Freemark 1983; Terborgh et al. 1990; Robinson et al. 1990). Much of the debate has been generated from disagreements in the results from studies of the two best known Neotropical bird communities: the Cocha Cashu site in Manu National Park in southeastern Peru (Terborgh et al. 1984, 1990; Robinson et al. 1990, 1995; Robinson & Terborgh 1990, 1995) and the Limbo site in Soberania National Park in central Panama (Karr 1971, 1990; Brawn et al. 1995).
In a 97-ha study area located on high-ground floodplain forest, Terborgh et al. (1990) used several different census methods, emphasizing spotmapping (Kendeigh 1944) to describe the bird community at Cocha Cashu. They found 245 resident species, including a total of 955 pairs/100 ha representing nearly 200 kg/100 ha of biomass. Approximately one-third of the species were present in densities of < 1 pair/100 ha. Average home range size was approximately four to five ha. In lowland central Panama, Karr (1971) relied more heavily on mistnetting and following individually colormarked birds on a 2-ha study area. There, he found 140 resident species, which were present at a combined population density of 1800 pairs/100 ha, ca. twice the density found at Cocha Cashu. The estimated biomass of birds, however, was nearly 50% less than in Peru (131 kg/100 ha). Terborgh et al. (1990) suggested the difference could be explained by the different census methods employed, including differences in spatial scale. They argued that a 2-ha plot is too small to sample adequately a Neotropical forest bird community because the average home range, or territory, size is larger than 2 ha. Population density estimates generated from small study plots would, therefore, be derived from fractions of territories of unknown size, rendering extrapolation to larger areas very difficult. For most species, they argued, such a small plot would not contain a single entire territory, and population densities could be overestimated. Therefore, the conclusion that avian densities were greater in Panama could be strongly affected by census methods rather than representing true geographic differences in community structure.
To improve comparisons of these Neotropical bird communities, we censused a 104-ha area (the Limbo plot) encompassing the original 2-ha Panama study area and used several census methods including those used at Cocha Cashu. Our specific objectives were to: (1) evaluate the influence of spatial scale on results reported from the Panama study site; and, (2) having minimized differences in census methodology, compare the community structure at Panama with that reported from Amazonian Peru. We conclude this paper by briefly suggesting several hypotheses to explain observed macrogeographic differences in community structure, most of which are based on the different biogeographic histories of the two study sites.
METHODS
Study area
We established a 104-ha study area, the Limbo plot, in lowland forest in Soberania National Park, Republic of Panama (9 degrees 9º 35º N, 79 degrees 44º 36º W; Fig. 1). Our study site encompassed the 2-ha plot originally investigated in 1968-69 (Karr 1971; Fig. 2). The Limbo plot is situated in a relatively flat basin of ca. 600 ha, surrounded on all sides by steep terrain. Elevation within the plot ranges from 35 to 80 m above sea level. A one-lane road runs through the plot, but has a closed canopy over most of its length.
The vegetation is classifed as tropical moist forest (Holdridge 1967) and receives annually ca. 2600 mm of rain with 90% falling during the late April to mid-December wet season (Windsor 1990). Wet season temperatures vary from mean daily lows of 23ºC to highs of 29ºC. Little rain falls during the dry season and mean daily low temperatures average 23ºC with highs of 32ºC. The canopy remains mostly closed throughout the year, with a few tree species shedding leaves during the dry season. Forest age varies from a few years old in the case of a 2.5-ha section damaged by a storm in 1992 to nearly 400 years old in remnant patches of tall forest in the northern sections of the plot (Karr 1971). The forest within 10 to 30 m of the narrow and little-traveled Pipeline Road is ca. 30 years old and virtually closes the canopy above the stretch of road through the Limbo plot. South of the road, the forest is 60 to 120 years old, apparently having been disturbed by farmers and the United States military earlier in the century (e.g., Foster & Brokaw 1982).
The most abundant tree species in the upper understory and canopy are Oenocarpus mapora, Welfia georgii, Tapirira guianensis, Socratea exorrhiza, Poulsenia armata, Virola sebifera, Lindackeria laurina, and Terminalia amazonia. The lower understory is dominated by Oxandra longipetala, Quassia amara, Sorocea affinis, Alseis blackiana, Cupania sylvatica, Protium panamense, Poulsenia armata, and Oenocarpus mapora. In the older forest, canopy height averages 30 to 40 m, whereas in the younger forest along the road it averages ca. 10 m less. Robinson et al. (in press) provide additional details.
Counting methods
To generate population density estimates comparable to those of Terborgh et al. (1990) for as many species as possible we used several methods, but our primary method was spotmapping (Kendeigh 1944; Terborgh et al. 1990; Robinson et al. in press). Briefly, in addition to spotmapping, we used extensive mist-netting efforts to capture and colour-ring individuals of understorey species, then mapped the locations of recaptures and visual sightings. For highly mobile species such as parrots, toucans, and other frugivores, we calculated the number of groups detected along transects across the study plot and multiplied the average group size by the average number of detections. To improve detection of some of the quieter territorial species such as Southern Bentbill Oncostoma olivaceum, Golden-crowned Spadebill Platyrinchus coronatus, and Ruddy-tailed Flycatcher Terenotriccus erythrurus, we walked transects between the 100-m grid trails. Nectarivores, aerial insectivores, and a few other species were so mobile that we were consigned largely to generating species lists. For species with home range sizes larger than 100 ha, such as raptors, we estimated the population densities for some of the species based on surveys in a 10 km2 area surrounding the plot.
We added one census technique not employed at Cocha Cashu: point counts (Verner 1985). We conducted 8-minute, unlimited radius counts at each of 126 points spread uniformly in a 100-m grid across the study area. Point counts thus provided the benefit of forcing even coverage of the entire study area. During a visit to a point we recorded the direction and the estimated distance (+10 m) away from the point for each bird detected aurally or visually. We made a total of eight visits to each point, four in the dry season, and four in the early wet season (May to July). We used a 100-m grid because preliminary efforts in the study area revealed that voices of some species would not carry > 50 m through the forest. Consequently, voices of some louder species could be heard from more than one point. We found that to be advantageous because we were then able to use the mapped observations from the point counts to supplement the spot-mapping data.
We conducted the majority of the censuses from 0.5 h before dawn until 1200, encompassing the principal period of song activity for most species as well as the mid-morning period when many raptors and other aerial species are conspicuous. More than 90% of the censuses were conducted by WDR. We censused on a weekly basis from January to July, 1994 and 1995, which encompassed the majority of the breeding season for most species, and biweekly from August through December, 1995, when song activity levels were generally substantially lower. Results from the two years were extremely similar so we pooled data and report one abundance measurement for each species. Annual variation in population density will be analyzed elsewhere. See Robinson et al. (in press) for additional details of annual variation.
We estimated territory (or home range) sizes by mapping the sightings of colormarked birds and the clusters of registrations of unmarked birds, including countersinging records, to provide additional measures for some species. We made measurements on a continuous scale for species for which we had >15 registrations per territory, which was the average number of registrations accumulated per territory at Cocha Cashu (Terborgh et al. 1990). For the remaining species at Limbo, we conservatively estimated territory size on a categorical scale with intervals of log2 width. Measurements could not be made for all species for reasons detailed in Robinson et al. (in press) and Terborgh et al. (1990).
We used mist-netting extensively to colour-ring individual birds and facilitate spotmapping. Six routes of 20 to 24 nets were opened for 2 or 3 consecutive days several (1-4) times each year.
We compared territory sizes at Limbo with those at Cocha Cashu (Terborgh et al. 1990). Because the measurements from Limbo were mostly categorical, we used contingency analyses (c2) to make most statistical comparisons. In cases where too many expected values in contingency tables were < 5, we derived exact probabilities instead of using asymptotic P-values (StatXact 1995). For comparisons of the territory size of the same species at both sites (measured on a continuous scale) we used a paired t-test.
We compared rank-abundance curves by first converting the data to cumulative frequency distributions with abundance measured on the abscissa in intervals of 1 individual/100 ha (except for two initial intervals for densities of < 0.5 and 0.51-1.0 individual/100 ha and three wider intervals for common species: 36-45/100 ha, 46-76/100 ha, and >76/100 ha). Cumulative frequency was measured on the ordinate. We then evaluated differences in the distributions with a Kolmogorov-Smirnov test (Smirnov 1948; Siegel & Castellan 1988: 144; SYSTAT 1992).
We used a Wilcoxon signed ranks test (corrected for continuity) when comparing the population density estimates from the original 2-ha census of Limbo with estimates from our 104-ha census.
All tests were two-tailed with P < 0.05 considered significant.
RESULTS
We generated >27,000 observations of birds on the Limbo plot including 2,900 mistnet captures of ca. 2,200 individual birds. See Robinson (1998) and Robinson et al. (in press) for the complete data. Here we review the key results needed to relate our findings to Karr's (1971) results and to results from Cocha Cashu.
Species richness
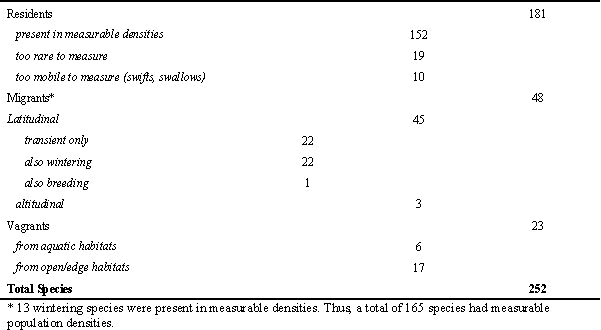
Of the 252 species we detected, 165 (65%) were present in densities of at least 0.5 pairs/100 ha. We classified 181 species, or 72% of the total, as residents capable of breeding in forest on or near the Limbo plot (Table 1). Fourteen species of migrants were resident on the plot for part of the year. We encountered one species of intratropical migrant, Piratic Flycatcher Legatus leucophaius, that bred on the study area. Three species of altitudinal migrants were detected, but only very rarely. Altogether, migrants accounted for 19% of the species total. Vagrants, which typically were species from aquatic or edge habitats, represented 9% of all species detected.
Species-abundance relationships
The eight most common species, all with abundances of >95 individuals/100 ha, accounted for 36% of the birds at Limbo. At the opposite extreme, only 26 (17%) of the 152 resident species for which we measured abundances were present at densities of < 1 pair/100 ha. Among territorial species, 106 territories of the most abundant species at Limbo (Slaty Antshrike Thamnophilus atrinucha) occurred on the study area. By comparison, 20 territories of the most abundant species at Cocha Cashu (Myrmoborus myotherinus) were present. Furthermore, the median population density was about 7 pairs/100 ha at Limbo, but only 2.5/100 ha at Cocha Cashu. Overall, the total number of individuals per 100 ha at Limbo was, at 3,234, nearly twice as high as the 1,910 at Cocha Cashu.
The distribution of species' abundances at Limbo was significantly different from the distribution at Cocha Cashu (Fig. 3; Kolmogorov-Smirnov test, P < 0.001). Most of the Limbo curve lies above the Cocha Cashu curve indicating: (1) a distribution of abundances that is more uneven at Limbo and (2), the Limbo community is composed to a greater extent of common species rather than rare ones. In the Cocha Cashu community most species are relatively equally abundant as indicated by the flat, long tail of the rank-abundance curve.
Territory sizes
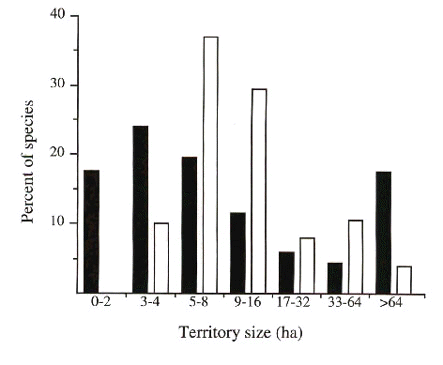
Territory sizes were smaller, on average, at Limbo than at Cocha Cashu (Fig. 4; c2 = 50.5, df = 6, P < 0.001). The median territory size was approximately 6 ha at Limbo compared with 9 ha at Cocha Cashu. No species had an average territory size smaller than 3 ha at Cocha Cashu, whereas 15 species had such small territories at Limbo. Because territory size is an ecological trait that could be influenced by phylogeny, a potential problem with our statistical comparison is the use of species as replicates (e.g., Harvey & Pagel 1991). Robinson et al. (in press) address this potential problem and report more extensive analyses, all of which support the conclusion that territory sizes tend to be smaller at Limbo than at Cocha Cashu.
Spatial patchiness
Most species were not uniformly distributed across the Limbo study area. Almost half (45%) of the species occupied less than half of the study area, and one-fourth of the species occupied less than 25% of the plot. The most obvious habitat feature that influenced bird distribution was topography, which was presumably associated with differences in soil drainage and plant species composition. At least four bird species were restricted to the foothills along the northern plot border, and rarely were encountered in the flatter sections of the study site; these included Sulphur-rumped Flycatcher Myiobius sulphureipygius, Southern Nightingale Wren Microcerculus marginatus, Tawny-throated Leaftosser Sclerurus mexicanus, and Spot-crowned Ant-vireo Dysithamnus puncticeps. Several species were found primarily in treefall gaps, which were not uniformly distributed across the study area. Gap species included Long-tailed Tyrant Colonia colonus, Black-bellied Wren Thryothorus fasciatoventris, and Dusky Antbird Cercomacra tyrannina. A few species were not present or rare on steep slopes, but were extremely common on flat terrain: Song Wren Cyphorhinus phaeocephalus, Spectacled Anpitta Hylopezus perspicillata, Black-faced Antthrush Formicarius analis and Spotted Antbird Hylophylax naevioides.
Guild structure and biomass
We classified birds into twenty different guilds based on diet, foraging substrate, and method of capture (Karr et al. 1990, Terborgh et al. 1990; Table 2). The most speciose guilds were the arboreal insectivores and the arboreal omnivores. The 59 species of arboreal insectivore comprised nearly one-fourth of the species in the entire community. Insectivores accounted for ca. 47% of the species in the Limbo bird community, whereas 23% were omnivores.
Insectivores also numerically dominated the community. Nearly two-thirds (64%) of all birds counted were insectivores. In contrast, insectivores, with a small average body mass of ca. 50 g, were markedly less important in biomass, comprising less than 25% of the total avian community biomass. Omnivores, however, contributed relatively equally to species richness (23% of all species in community), numbers of individuals (19%), and biomass (17%). Frugivores comprised less than 10% of the species and individuals in the Limbo community, but they represented almost one-fifth (18%) of the community biomass. Similarly, granivores were even less species rich (10 species) and accounted for <3% of individuals, but represented nearly 30% of the community biomass. Granivores and frugivores combined accounted for nearly one-half of the biomass while constituting less than one-tenth of the species total.
DISCUSSION
We recorded 252 species during our surveys of the 104-ha Limbo study area compared with 161 species observed by Karr (1971) on his 2-ha plot, which was nested within the area covered by our larger plot. The occurrence of greater species richness on a larger area was expected because measurements of species richness characteristically increase with sampling area (e.g., Arrhenius 1921, 1923; Preston 1960, 1962; MacArthur & Wilson 1963, 1967) and sampling effort (Williams 1964). But how great was the difference in assessment of species richness? Combining Karr's 'resident,' 'regular,' and 'irregular' categories into a single resident category like ours, we calculate that 133 resident species, 27 migrants, and 1 vagrant were observed by Karr on the 2-ha plot. Thus, we found an additional 38 residents, 23 migrants, and 20 vagrants on the 104-ha study plot.
Is the 2 ha studied by Karr simply unusually depauperate relative to other areas in the 104-ha plot leading to an exaggeration of the influence of spatial scale on measures of species richness? Two analyses suggest the answer is no. First, our preliminary comparison of rarefaction curves (see e.g., Gotelli & Graves 1996) generated from Karr's inventory of the 2-ha plot and our inventory of the 104-ha plot suggests similar levels of species richness (W. D. Robinson, unpublished data). Second, we compared the species richness of Karr's plot with the species richness in eight randomly chosen 2-ha subplots within our 104-ha plot (Table 3). Karr's measure of 161 total species falls within 2 standard deviations of the mean richness of the random plots, but tends to be higher than the richness of most of the random plots, primarily because of the large number of migrant species detected. Our own measure of 182 species in Karr's 2-ha plot fell > 2 standard deviations above the mean richness of the random plots. The lower estimate of richness generated by Karr's 2-ha census relative to our 104-ha census cannot be explained simply by an unusually depauperate location for the small plot.
On an even larger scale, within the 22,000-ha Soberania National Park an additional 21 forest-dwelling species that we did not detect at Limbo have been recorded within the last 30 years; only 9 of these, however, have been observed regularly within the last 5 years (Robinson 1998). Some species seem to have disappeared, most of which are altitudinal migrants and large raptors (Robinson et al. in press). Using the latter figure as the number of species that were realistically present within the park during our surveys our plot was large enough to detect 95% of the forest species present. Nearly all of those missing were species which inhabit steep terrain. Similarly, Terborgh et al. (1990) detected on their 97-ha plot >98% of all lowland forest species known to occur in the immediate region of Manu. On the 2-ha Panama plot, Karr detected 74% of the forest species. Thus, spatial scale of the study area had an important effect on enumeration of species richness.
Population density estimates
The possibility that spatial scale may have lead to inflated estimates of population densities in Panama was of primary concern to Terborgh et al. (1990). Karr's (1971) estimate of 3,600 individuals per 100 ha was remarkably similar to our estimate of ca. 3,200 individuals per 100 ha. Does this close agreement, then, indicate 2 ha is a large enough area for estimating population densities in this particular forest?
To address this question, we looked at the estimates for the individual species. The first important result from our analysis is that density was estimated from the small-scale study for almost 100 fewer species than from our large-scale study. We measured densities for 152 resident species, whereas Karr presented measurements for 56 species. This difference suggests that the estimates for each species from the 2-ha plot must have been disproportionately high to generate an estimate of total number of individuals per 100 ha that was so similar to the estimate derived from measurements of nearly three times as many species on large the plot. Alternatively, most estimates might be similar, but the higher total could result from much greater population densities estimated for a handful of species during the first census. Further, populations of those species could have declined in the intervening years. We examined these possibilities by comparing the estimates for each of the 53 species for which both studies estimated densities (Table 4).
Estimates from the small-scale study were significantly greater than those from the large plot (Wilcoxon signed ranks test, Z = 3.99, P < 0.0001). Estimates were higher for 33, lower for 18, and equivalent for two of the 53 species. Among species for which estimates were higher from the small-scale study, the average deviation from the large-scale plot estimates was 61.5% (± 24.2 S.D.). When estimates from the 104-ha plot were higher, they averaged 39.2% (± 20.8) greater. Densities of some species included in the analysis are more difficult to estimate than others because of highly variable populations among years, patchy spatial distributions, or because of high mobility (Table 4). Nevertheless, when these 19 species are removed, the small-scale study still generated significantly larger estimates (Z = 2.43, P < 0.015). The number and magnitude of the differences between estimates derived from the two plots strongly suggests that the small spatial scale of the 2-ha study lead to inflated population density estimates.
Biomass
Because methodological differences have affected population density estimates made by the small- and large-scale studies, we cannot make many useful comparisons of measures of community biomass between the two studies. However, we should note that changes in hunting pressure since the late 1970s appear to have had some effects. Some of the more prized species such as Great Curassow (Crax rubra) and Great Tinamou (Tinamus major) have apparently increased in abundance in the Limbo area since the establishment of the Soberania National Park (J. R. Karr, personal communication). These large species contribute substantially to biomass calculations, and their presence facilitates comparisons with Cocha Cashu where hunting pressure is minimal.
Comparison with Cocha Cashu
Modification of spatial scale and census techniques had minimal effects on previous conclusions about geographic differences in community structure. The Limbo and Cocha Cashu bird communities are differently structured. Limbo has 25% fewer resident species, half as many constitutively rare species, and nearly two times as many total birds. In particular, Limbo hosts approximately twice as many insectivorous birds as Cocha Cashu. Despite the reduced importance, both in richness and population density, of granivores at Limbo, the exceptional abundance of insectivores at Limbo causes the community biomass of the two communities to be very similar. Thus, by most simple comparative measures of community structure, Limbo and Cocha Cashu are very different.
We hypothesize that many of the differences arise from differing biogeographic histories. Panama probably has been disturbed to a greater degree than the Amazonian basin location in which Cocha Cashu lies; these disturbances span a wide range of time scales from geological to recent. For example, the Panamanian isthmus was greatly influenced by changing sea levels during the Miocene, which affected the total amount of land area present in the region as well as climate (Collins et al. 1996). Furthermore, the isthmus may have been more heavily influenced by elevational shifts in forest distribution during Pleistocene cooling periods than was lowland Amazonia (Bush et al. 1992, Bush & Colinvaux 1994). More recently, disturbance by humans at Limbo has reduced the average forest age to <120 years, compared to about 400 years at Cocha Cashu (Robinson et al. in press; Terborgh et al. 1990). Because avian diversity (richness) increases with forest age in the Neotropics (Robinson & Terborgh 1997), the younger forest age at Limbo may in part reduce the richness there.
Area effects are likely to have been important as well. Limbo lies on a tiny area of lowland forest compared to the vast expanse of Amazonian forest in which Cocha Cashu lies. This small area is situated on a narrow (ca. 90 km wide) isthmus as well, which may restrict species richness in a manner similar to the peninsula effect described by Simpson (1964). The lower species richness, but greater total density of birds and relative equality of community biomass, is suggestive of density compensation (MacArthur et al. 1972). However, avian abundances at Limbo when analyzed on a guild by guild basis are sometimes twice as great as at Cocha Coshu despite richness being only 25% less at Limbo. Thus, the observed patterns do not exactly match the patterns predicted if density compensation were occurring. We have only briefly suggested several hypotheses to explain the differences in community structure; Robinson et al. (in press) explore these hypotheses in more detail.
Importance of spatial scale
The spatial scale at which Neotropical bird communities have been investigated has often been too small. Most studies have been conducted on areas of < 25 ha (Davis 1955; MacArthur et al. 1966; McClure 1969; Orians 1969; Terborgh & Weske 1969; Karr 1971; Fogden 1976; Bell 1982). The extraordinarily patchy distributions of species, even within tracts of apparently 'uniform' habitat, will cause an underestimation of local species richness when very small plots are used. Although the 104-ha Limbo plot hosted more than 95% of the locally-occurring forest species, and the 97-ha Cocha Cashu plot hosted 99% of the local, mature floodplain forest species (Terborgh et al. 1990), areas even of that scale will not always be large enough. In the 100-ha French Guiana study, for instance, only 77% of the locally-occurring forest avifauna were observed (Thiollay 1994).
A similar difficulty has beset studies of population densities. As shown in our comparison of estimates from the original 2-ha Limbo plot and the current 104-ha plot, studies of small areas can generate very different population density estimates. Three overlapping factors are important. First, few of the species present will occur within the small area frequently enough to generate sufficient observations to allow adequate estimates. In our comparison, 2 ha allowed estimates for a third of the number of species the 104 ha allowed. Second, small plots are unlikely to sample adequately the patchy distributions of birds. At both Limbo and Cocha Cashu, ca. 50% of species were present on less than half of the study areas. Third, many species have territory sizes that are large, relative to territory sizes of temperate birds, so plots must be big enough to include the entire territory before accurate estimates can be made.
Plots may need to be huge to encompass a sufficient number of territories to describe the variability in territory size, or to generate robust density estimates. It could be argued, for example, that in Amazonia, where two recent studies have shown a third of the species to occur in densities of <1 pair per 100 ha, a sample of 100 ha provides on average only a single territory from which to derive density estimates for those species. Surely, with such small samples, the degree of uncertainty of measurement is great.
Last, most tropical forest species have global population sizes that are orders of magnitude smaller than the temperate species to which monetary conservation resources are directed (see, e.g., Stotz et al. 1996). Thus, not only is documentation of population densities important for ecologists interested in basic issues in biology, but such measurements are critical for demonstrating the magnitude of the differences between tropical and temperate communities. Conservation efforts can only be aided when the degree to which tropical organisms are exposed to inherently higher risk of extinction, by way of their smaller population sizes, are made abundantly clear.
ACKNOWLEDGMENTS
The Smithsonian Tropical Research Institute (STRI) Environmental Sciences Program supported our investigations. WDR was also supported by grants from the Frank M. Chapman fund; the Alexander Wetmore Memorial Award of the American Ornithologists' Union; and the Center for Latin American and Carribean Studies, the Dept. of Ecology, Ethology, and Evolution, the Graduate College, and the School of Life Sciences, at the Univ. of Illinois at Urbana-Champaign. K. Kaufman generously assisted with computer programming. R. Condit shared unpublished data on vegetation composition of the study area. We are grateful to IN.RE.NA.RE for allowing us the privelege to study birds in the Republic of Panama. We have benefitted from discussions with C. K. Augspurger, G. O. Batzli, A. E. Herre, E. K. V. Kalko, J. R. Karr, E. G. Leigh, S. Russo, D. Stotz, P. Stouffer, and S. J. Wright.
REFERENCES
Arrhenius, O. 1921. Species and area. Journal of Ecology 9: 95-99.
Arrhenius, O. 1923. Statistical investigations in the constitution of plant associations. Ecology 4: 68-73.
Bell, H.L. 1982. A bird community of lowland rainforest in New Guinea. I. Composition and density of the avifauna. Emu 82: 24-41.
Brawn, J.D., Karr, J.R. & Nichols, J.D. 1995. Demography of birds in a neotropical forest: effects of allometry, taxonomy, and ecology. Ecology 76 :41-51.
Bush, M.B. & Colinvaux, P.A. 1994. Tropical forest disturbance: paleoecological records from Darien, Panama. Ecology 75: 1761-1768.
Bush, M.B., Piperno, D.R., Colinvaux, P.A., De Oliveira, P.E., Krissek, L.A., Miller, M.C. & Rowe, W.E. 1992. A 14 300-yr palaeoecological profile of a lowland tropical lake in Panama. Ecological Monographs 62: 251-276.
Collins, L.S., Coates, A.G., Berggren, W.A., Aubry, M.-P. & Zhang, J. 1996. The late Miocene Panama isthmian strait. Geology 24: 687-690.
Davis, L.I. 1955. Bird census 27. Audubon Field Notes 9: 425-426.
Fogden, M.P.L. 1976. A census of a bird community in tropical rain forest in Sarawak. Sarawak Museum Journal. XXIV 45:251-267.
Foster, R.B., & Brokaw, N.V.L. 1982. Structure and history of the vegetation of Barro Colorado Island. In: Leigh, E.G., Jr., Rand, A.S. & Windsor, D.M. (eds) Ecology of a tropical forest: 67-81. Washington, D.C., USA; Smithsonian Institution Press.
Gotelli, N.J., & Graves, G.R. 1996. Null models in ecology. Washington, D.C., USA; Smithsonian Institution Press.
Harvey, P.H., & Pagel, M.D. 1991. The comparative method in evolutionary biology. Oxford, England; Oxford University Press.
Holdridge, L.R. 1967. Life zone ecology. Occasional Papers of the Tropical Science Center (San Jose, Costa Rica).
Karr, J.R. 1971. Structure of avian communities in selected Panama and Illinois habitats. Ecological Monographs 41: 207-233.
Karr, J.R. 1990. The avifauna of Barro Colorado Island and the Pipeline Road, Panama. In: Gentry, A.H. (ed.) Four neotropical rainforests: 183-198. New Haven, Connecticut, USA; Yale University Press.
Karr, J.R., & Freemark, K.E. 1983. Habitat selection and environmental gradients: dynamics in the 'stable' tropics. Ecological Monographs 64:1481-1494.
Kendeigh, S.C. 1944. Measurement of bird populations. Ecological Monographs 14: 67-106.
MacArthur, R.H., Diamond, J.M. & Karr, J.R. 1972. Density compensation in island faunas. Ecology 53: 330-342.
MacArthur, R.H., Recher, H. & Cody, M.L. 1966. On the relation between habitat selection and species diversity. Am. Nat. 100: 319-332.
MacArthur, R.H. & Wilson, E.O. 1963. An equilibrium theory of insular zoogeography. Evolution 17: 373-387.
MacArthur, R.H. & Wilson, E.O. 1967. The theory of island biogeography. New Jersey, USA; Princeton University Press.
McClure, H.E. 1969. Estimations of bird population density in primary forest of Malaya. Malay Nature Journal 22: 179-183.
Orians, G.H. 1969. The number of bird species in some tropical forests. Ecology 50: 783-801.
Preston, F.W. 1960. Time and space and the variation of species. Ecology 41: 611-627.
Preston, F.W. 1962. The canonical distribution of commonness and rarity: part I. Ecology 43:185-215; part II. Ecology 43: 410-432.
Robinson, S.K., & Terborgh, J. 1990. Bird communities of the Cocha Cashu Biological Station in Amazonian Peru. In: Gentry, A.H. (ed.) Four neotropical rainforests: 199-216. New Haven, Connecticut; Yale University Press.
Robinson, S.K., & Terborgh, J. 1995. Interspecific aggression and habitat selection by Amazonian birds. Journal of Animal Ecology 64: 1-11.
Robinson, S.K., & Terborgh, J. 1997. Bird community dynamics along primary successional gradients of an Amazonian whitewater river. In: Remsen, J.V., Jr. (ed.) Studies in neotropical ornithology honoring Ted Parker. Ornithological Monographs Number 48, American Ornithologists' Union, Washington, D.C., USA.
Robinson, S.K., Terborgh, J. & Munn, C.A. 1990. Lowland tropical forest bird communities of a site in Western Amazonia. In: Keast, A. (ed.) Biogeography and ecology of forest bird communities: 229-258. The Hague, The Netherlands; Academic Press.
Robinson, S. K., Fitzpatrick, J.W. & Terborgh, J. 1995. Distribution and habitat use of Neotropical migrant landbirds in the Amazon basin and Andes. Bird Conservation International 5: 305-323.
Robinson, W.D. 1998. Community structure, nesting success, and isolation effects in a tropical forest bird community. PhD thesis, University of Illinois, Urbana-Champaign, Illinois, USA.
Robinson, W.D., Brawn, J.D. & Robinson, S.K. in press. Structure of a forest bird community in central Panama: Influence of spatial scale and biogeographic history. Ecology
Siegel, S. & Castellan, N.J., Jr. 1988. Nonparametric statistics for the behavioral sciences. Second edition. New York; McGraw-Hill Book Co.
Simpson, G.G. 1964. Species density of North American recent mammals. Systematic Zoology 13: 57-73.
Smirnov, N.V. 1948. Table for estimating the goodness of fit of empirical distributions. Annals of Mathematical Statistics 19: 279-281.
StatXact. 1995. Statistical software for exact nonparametric inference. Cytel Software Corp., Cambridge, Massachusetts, USA.
Stotz, D.F., Fitzpatrick, J.W., Parker, T.A., III, & Moskovits, D.K. 1996. Neotropical birds: ecology and conservation. Chicago, Illinois, USA; University of Chicago Press.
SYSTAT. 1992. SYSTAT: Version 5.2. SYSTAT, Inc. Evanston, Illinois, USA.
Terborgh, J. & Weske, J.S. 1969. Colonization of secondary habitats by Peruvian birds. Ecology 50: 765-782.
Terborgh, J., Fitzpatrick, J.W. & Emmons, L.H. 1984. Annotated checklist of bird and mammal species of Cocha Cashu Biological Station, Manu National Park, Peru. Fieldiana, Zoology 21: 1-29.
Terborgh, J., Robinson, S.K., Parker, T.A., III, Munn, C.A. & Pierpont, N. 1990. Structure and organization of an Amazonian forest bird community. Ecological Monographs 60: 213-238.
Thiollay, J.-M. 1994. Structure, density, and rarity in an Amazonian rainforest bird community. Journal of Tropical Ecology 10: 449-481.
Verner, J. 1985. Assessment of counting techniques. Current Ornithology 2: 247-301.
Wiens, J.A. 1989. Spatial scaling in ecology. Functional Ecology 3: 385-397.
Williams, C.B. 1964. Patterns in the balance of nature. Academic Press, New York.
Windsor, D.M. 1990. Climate and moisture variability in a tropical forest: long-term records from Barro Colorado Island, Panama. Smithsonian Contributions to Earth Sciences, Number 29.
Table 1. Distribution of bird species at Limbo by residency status (see text for definitions).

Table. 2. Guild structure of the Limbo bird community. Resident species only are included.
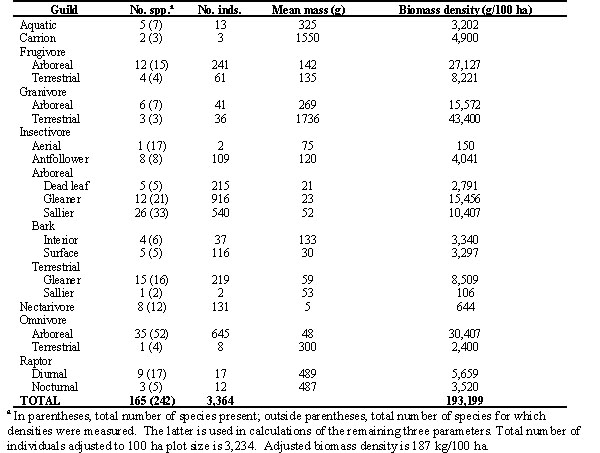
Table 3. Comparison of the number of species detected on 8 randomly located 2-ha subplots within the 104-ha plot with the numbers detected by Karr (1971) in 1968-69 and by us in 1994-95 on Karr’s 2-ha plot.

Table 4. Comparison of population density estimates of the 53 bird species for which both Karr (1971) and we made estimates. Estimates are shown as number of individuals per 100 ha. Percent difference was calculated by taking the absolute value of the difference between each pair of estimates and dividing by the higher estimate. Positive values indicate that the estimate derived from the 2-ha study was higher, whereas negative values indicate the 2-ha estimates were lower than estimates from the 104-ha study.
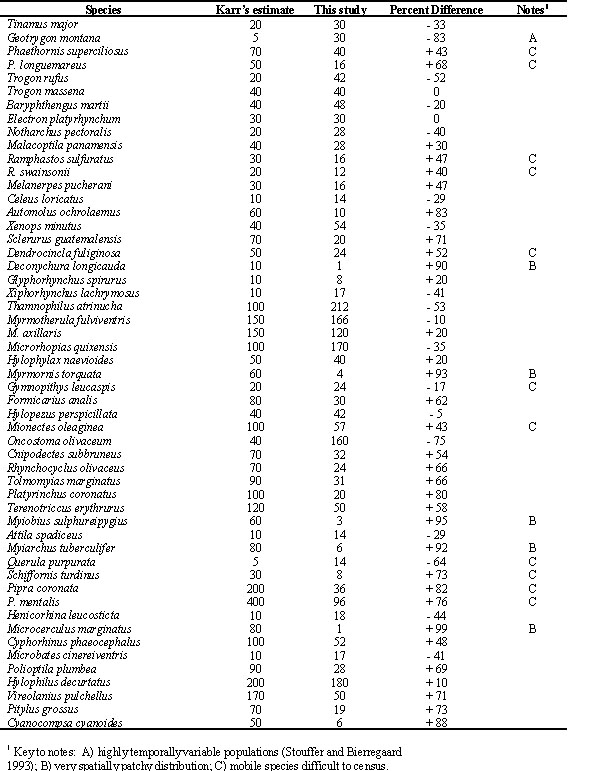
Fig. 1. Location of the Limbo plot in Soberania National Park in central Panama.
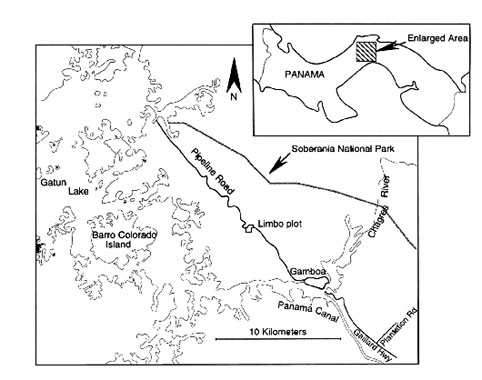
Fig. 2. Map of the 104-ha Limbo plot showing locations of streams, topographic contour lines (intercontour interval is 20 m), and Pipeline Road. Locations of the 126 permanent point count stations are indicated by a +. The original 2-ha study area is outlined in the north-central section of the plot. Net locations are indicated by the small dashes.
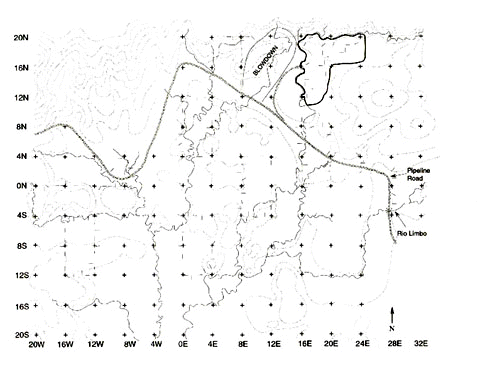
Fig. 3. Rank-abundance curves derived from 104-ha Limbo plot (solid lines) and Cocha Cashu (dotted lines). The lower two curves indicate the ranked abundances based on the raw data, the upper curves the log-transformed data.
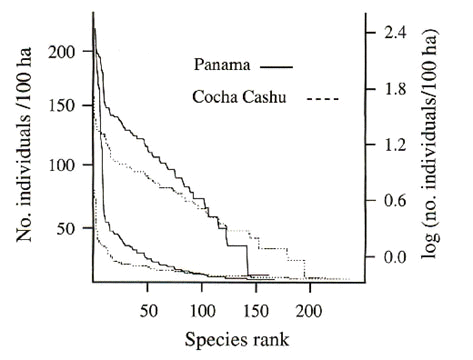
Fig. 4. Distribution of territory sizes for bird species at Limbo (closed bars; n=87 species) and Cocha Cashu (open bars; n=111 species; Terborgh et al. 1990).
