S41.5: Dispersal in fragmented landscapes: Problems for birds and for researchers, a case study of Great Reed Warblers Acrocephalus arundinaceus
Ruud P.B. Foppen1 & Jaap Graveland2
1DLO-Institute For Forestry and Nature Research PO Box 23 6700 AA Wageningen The Netherlands, e-mail r.p.b.foppen@ibn.dlo.nl; 2RIKZ Institute for Coastal and Marine Management PO Box 8039 4330 Middelburg, The Netherlands
Foppen, R.P.B. & Graveland, J. 1999. Dispersal in fragmented landscapes: Problems for birds and for researchers. In: Adams, N.J. & Slotow, R.H. (eds) Proc. 22 Int. Ornithol. Congr., Durban: 2499-2513. Johannesburg: BirdLife South Africa.In many population studies in fragmented landscapes it is suggested that dispersal is the crucial process in determining the viability. However, only few large data sets exist on dispersal in both continuous and fragmented landscapes. Dispersal studies, particularly on birds, are difficult and time consuming. Ringing data show bias, studies tracking individuals suffer from a lack of data. Most promising seem ringing studies aiming at resighting of animals. However, large birds show large dispersal distances and thus need huge areas to be covered for resightings and thus have to deal with observation biases and small birds are difficult to observe. Part of the solution is combining the empirical data with modelling efforts incorporating these data in population models. In this way sensitive parameters can be determined which can focus the research aims and hypothesis concerning the functioning of fragmented landscapes can be checked. We present a study on dispersal of the Great Reed Warbler in the Netherlands. The data on capture/resighting were analysed with help of the capture/recapture model SURGE and regression techniques were used to filter out the dispersal characteristics of the species. These data were used for optimising a dispersal module of a spatially explicit population model called METAPHOR.
INTRODUCTION
Dispersal is the key process for understanding the effect of habitat fragmentation on population dynamics (e.g. Opdam 1990; Matthysen et al. 1995). However, in many studies researchers are confronted with the fact that it is very difficult to find sufficient data to describe the relevant dispersal parameters, like the emi- and immigration rate and the characteristics of the dispersal distance distribution. A common technique is mark-recapture analysis of ringing data, but also radio-transmitters are used to track down individuals and to learn about their movements (e.g. Bensch 1993). Both methods are very time-consuming and a large dataset is needed for a reliable analysis. For mark-recapture usually two approaches are chosen: passively collected recoveries of aluminium ringed individuals by ringing stations or active search for resightings of, usually colour-banded, individuals. The first approach has the advantage of large numbers but suffers from bias in data because of unequal search effort (Van Noordwijk 1996). The latter approach is very time consuming but the search effort is under control. Since individuals can be followed in course of the breeding season not only dispersal data can be collected but also other demographic data like mortality and reproduction. A problem in analysing mark-recapture (or resighting) data is that it is difficult to distinguish between mortality and displacement (as result of a dispersal event), see e.g. Schwarz (1993). Usually the calculated mortality is derived from the local survival, indicating that for a certain area it is not known whether an individual has survived outside this area or not. For understanding the population dynamics in a fragmented population however, it is crucial to quantify both processes.
In this paper we present the first results of a study on a population of Great Reed Warblers Acrocephalus arundinaceus a reed-dwelling, migratory songbird. This species has become quite rare in the Netherlands, a main cause probably being reed degradation (Graveland 1998). This species is strongly associated with early successional stages of reedbeds along lakes and watercourses during the breeding season. The availability of this type of habitat has greatly decreased and become heavily fragmented during the last decades in the Netherlands and elsewhere in Europe (Ostendorp 1993; Graveland 1998). The Great Reed Warbler is a rare species in the Netherlands nowadays, with a population of approximately 300 pairs. To judge what effect fragmentation has on the population dynamics of the Great Reed Warbler, and to be able to evaluate plans concerning the restoration of reed marshlands, the Institute of Forestry and Nature Research (IBN-DLO) in the Netherlands is developing a spatially explicit population model for this species. To obtain data for important parameters in the model (reproduction, mortality and dispersal) a colour-banding study was started. In this article we present the first results of a field study focussing on dispersal characteristics of the species and describing a method for the estimation of the emigration rate by disentangling mortality and emigration.
Although individual dispersal events were recorded during the study, it was not the intention to describe dispersal mechanisms of the species, e.g. by explaining individual movement patterns, the study intended to derive estimates for average distances and directions which could directly be implemented in the population model.
METHODS
The study was started along the former lake Zuiderzee in the north of the Netherlands in 1994 (Fig. 1). The habitat consists of reed beds along watercourses, roughly about 40 kilometres long. The width of the reedbeds varied, but the Great Reed Warbler usually nested in the outer 10-25 meters of the reedbed. About 175 breeding pairs occurred in the area, which represents more than 50% of the Dutch population. In the centre of the area around the localities Zwarte Meer and Weerribben (Fig. 1) adults and nestlings were caught and individually marked with colour bands. Adults (mostly males, some females) were caught by play-backing the song under a Japanese net in the reedbed and nestlings were ringed in the nest just before fledging. It is assumed that 80% of the adult men and 90% of the nestlings were colour-banded. The colour combinations of returning individuals could be identified with binoculars and telescopes. Up to 15-20 kilometres from the main study area all sites with territorial males were visited and the individuals were checked for colour rings. In marshlands in other parts of the Netherlands with important local populations (>10 pairs), individuals were checked for colour rings as well (Fig. 1). We estimate that for the males more than 75% of the Dutch population was checked for colour rings in the most recent years.
Marked males were usually identified at their songposts, females at the nests when they tended their young. Observations were plotted on digitised maps of the study area.
Analysis of the data consisted of two kinds of calculations:
1) estimating (local) survival by modelling exercises using the computer programs MARK and RELEASE (Cooch et al. 1996). Basic assumption of the underlying model is that the chance that a marked individual is resighted is the chance that the individual has survived combined with the chance that it can be seen in a given year (Lebreton et al. 1992). Models with various factors explaining the mortality can be fitted (Cooch et al. 1996). We tested the factors age, sex (only for adults), site and hatching date (only for nestlings, early and late group). Besides biological sense on what factors are likely to play a role, the Akaike´s Information Criterion was used to be able to discriminate between models (Lebreton et al. 1992). This criterion is a combination between a maximum likelihood approach, using the change in deviance between models, and the number of parameters in the model.
2) estimating the emigration rate using a modified approach of the methods described by Manly and Jackson (Jackson 1939; Begon 1979; Manly 1985). Various methods have been developed to unravel emigration and survival, resulting in models for fish populations (Nichols et al. 1993; Schwarz 1993), models using genetic data (Van Noordwijk 1993) and the models of Jackson and Manly. We used the latter because they are relatively simple to be applied and suited well to our data. In the original design of Jackson (Jackson 1939) the study area is represented as a square subdivided in four equally sized squares (Fig. 2.). For each individual it is known in which square an individual was born or held a territory in a given year. In every square the local survival can be calculated. This local survival chance can be described as:
f small = f (1-g)
f large = f (1-g/2)
with f small, large the local survival chance in resp. a subsquare and the total square, f the survival rate for the total population and g the emigration fraction from a subsquare, i.e. the fraction of individuals that were known to emigrate. The f , the survival without the emigration fraction for every square(size) is equal, since one can assume that survival is not dependent on size of the squares. The emigration rate (g) however, will depend on square size. The emigration fraction for the large square is half of the emigration fraction from a subsquare due to the fact that half of the individuals from a subsquare will end up in the large square. Knowing f small and f large will make it possible to calculate f and g by solving the mathematical equation.
We modified this approach using rectangulars instead of squares under the assumption that most of the habitat of the Great Reed Warbler in the study area is linearly shaped and that individuals are unlikely to move perpendicular to the reedbeds outside the study site (Fig.3). This implies that individuals are not expected to disperse in every direction but only from rectangular to rectangular longitudinal. This assumption will only hold when birds disperse directly from their breeding area or place of birth to their future breeding site. Although no information is available for Great Reed Warblers, for several close relatives (Reed Warbler A. scirpaceus and Sedge Warbler A. schoenobaenus) evidence has been presented supporting this (Catchpole 1972).
Part of the study area, with the largest concentration of territories, Ketelmeer and Zwarte Meer, consisting of linear patches of reed along watercourses, was split into six parts, with a length of about 2.5 kilometre of reed beds. The size of each part, representing a rectangular (from now on called basis rectangular) was determined by a minimal number of individuals needed to calculate a reliable survival rate (around 75 marked individuals) and the median dispersal distance. The length of the basis rectangulars was adjusted for habitat distribution, since banks with non-habitat were not considered. It was assumed that the Great Reed Warbler is not hampered by these non-habitat stretches. For the main study area this is a reasonable assumption since the non-habitat stretches are small and scattered relative to the average dispersal distance (see also results). For this species the study area is not considered to be a fragmented landscape, so it is assumed that dispersal distance is not influenced by habitat configuration.
The formula used for the squares then changes in (see Fig. 3):
f 1 rectangular = f (1-g)
f 2 rectangulars =f (1-g/2)
f 3 rectangulars = f (1-g/3),
in general:
f i rectangulars = f (1-g/i)
Again, f i rectangulars representing the local survival in a combination of i basis rectangulars, f representing the survival rate without emigration and g the emigration rate in a basis rectangular.
For every basis rectangular and the pooled rectangulars the survival was calculated. Consequently, for the six basis rectangulars six survival estimates are available, pooling two basis rectangulars will allow five estimates, pooling three will allow four, and so on, reflecting the number of combinations of joined basis rectangulars that can be made. Finally, there will be one estimate for the situation with all basis rectangulars pooled (= local survival in the whole study area) Since the number of individuals in every (pooled) rectangular differs, the estimates differ in reliability. Therefore, a weighted regression of the local survival (as response variable) on the reciprocal number of rectangulars (as predictor variable) determines total survival (intercept) and the survival*emigration fraction (regression coefficient). As weighing factor the reciprocal of variance was used. The emigration rates for the different rectangular sizes could be calculated with 95% confidence limits using the approach of Fieller (Finney 1964).
RESULTS
Numbers of marked and resighted birds
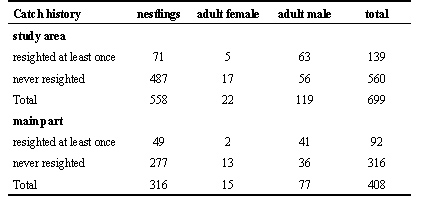
558 Nestlings and 141 adults were colour-banded in the total study area from 1994 to 1996. In the main linear part 316 nestlings and 92 adults were marked (Table 1). 13% Of the nestlings and 48% of the adults were resighted in one or more years.
Calculated survival rates
Testing showed that the basic assumptions for a reliable modelling were not violated severely. The survival and the probability that a bird was resighted were equal for each group. The assumption that catch history is not of influence, which is also an important assumption for the model, does not hold. Nestlings returning after one year had a lower chance of being ‘caught’ than second years returning in a subsequent year. This is probably caused by the fact that second-years do not always breed and therefore behave less conspicuous. Consequently, age was included as a parameter in the model.
First, a model was constructed with the parameters age, sex and year. The models that had to be compared were divided in three groups (Table 2, Lebreton et al. 1992):
I: Basic modelling: f (survival estimate) and p (catch probability estimate) depend upon the same factors
II: Resight modelling: choosing a model for p by keeping f constant from model I and varying the effects for p
III: Survival modelling: choosing a model for f by varying f and fixing p
After choosing the best model with these factors other factors can be added.
The most parsimonious model with the factors year, age and sex proved to be a resight model. On the basis of the results, using the AIC, number 6 proved to be the best model. However, adding this extra parameter makes the estimates of survival very unreliable. The ecologically most relevant and next best model was nr. 8: with survival dependent on age and sex and probability of resighting dependent on age and only for the adults on sex (table 2) and this model was chosen for estimating the survival. The factors hatching date, year and site of birth did not contribute significantly to this model.
The estimates for survival and probability of resighting are presented in Fig. 4. Males showed a somewhat higher survival than females, due to the small number of females caught, causing very large confidence limits, the difference is not significant. Since the sex of the ringed nestlings could not be determined no difference in catch probability and survival was calculated.
Dispersal distance
Great Reed Warblers showed a rather limited dispersal (Fig. 5.) Most nestlings dispersed less than 10 kilometres (80% limit), maximum 70 and most adults even less than four kilometer, maximum 20.
Emigration rate
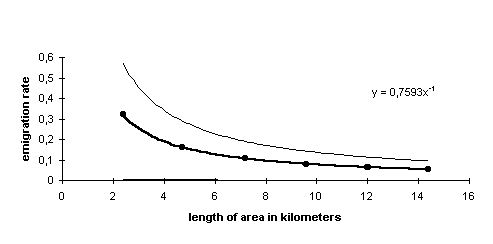
As an example, (Fig. 6) shows the calculated local survival for adult males in the different rectangulars and the resulting regression. The size of the area is represented as a length of reed beds following the linear shape of most habitat patches. Adult males showed a low dispersal rate, from a stretch of 2.5 kilometer around 30% emigrated. The emigration rates for nestlings are around three times as high as for adults.
DISCUSSION
The results of the study showed that with a set of capture-recapture data it is possible to separate mortality and emigration. A prerequisite is that the area which will be checked for colour-banded individuals is large compared to the average dispersal distance, otherwise a reliable estimation of the survival rate is not possible. This condition was satisfied quite well in this study. The dispersal curves of the Great Reed Warbler showed that most of the individuals do not disperse further than 10 kilometres. Around the main study area of Zwarte Meer and Ketelmeer all available habitat in a radius of 15 to 20 kilometer was checked each year and furthermore the most important breeding sites outside this region (at distances up to 100 kilometres) were regularly visited. Consequently, the estimated survival rates for the total population are quite reliable, with the exception of females (Fig. 3). Furthermore, the chance on a resighting should be equal for the whole search region otherwise bias will occur (Van Noordwijk 1995). Although no exact data exist there are strong indications that in the study area this condition will hold. Since the distribution of Great Reed Warblers is rather clumped, most territories occurred in clusters in a rather small number of areas; search effectivity was quite high.This is reflected in the fact that almost three-quarters of the total population was checked for colour rings in the most recent years. The clumped distribution probably is a reflection of the habitat quality and the effect of social attraction. Although habitat selection aspects could play a role in explaining the dispersal characteristics of the species it is considered to be a process on a lower scale level. Moreover, the optimal habitat spots in the study area were quite evenly distributed and this also reduces the potential effects of habitat selection processes on the dispersal.
The survival rates for adults were high compared to other songbirds. Correspondingly, ringing data suggest that the Great Reed Warbler has a relatively long life span (Cramp & Brooks 1992). The juvenile survival rate falls well within the limits for other passeriformes (for reviews see Von Haartman 1971; Bulmer & Perrins 1973).
The fact that nestlings showed a lower probability of resighting is probably caused by the fact that not every second-year will breed, a substantial part will only start breeding in their third year (Bart 1995). Females showed a considerably lower probability of resighting since their behaviour is much more inconspicuous. Consequently, the number of resighted females was low and the survival value can only be given with large confidence limits.
The Jackson method proved to be useful for estimating emigration rates in our population. The method could simply be applied to our capture-recapture data and we believe the results give a reliable estimate (be it with quite substantial confidence limits). The rectangulars were pragmatically chosen on basis of the number of ringed individuals. Continuation of the study and enlarging the data set will make it possible to use smaller rectangulars and, consequently, calculate more reliable emigration rates.
Since the question remains how fragmented landscapes influence dispersal the data of our study will be analysed further considering this aspect. We intend to compare the actual dispersal distances with simulated data assuming different dispersal mechanisms. Also this includes recoveries over large distances covering areas with non-habitat outside the main study area. Using the method developed in this study we hope it might be possible to estimate the mere effects of fragmentation by comparing dispersal characteristics in fragmented and unfragmented landscapes. In the near future we also intend to get more information on the individual dispersal behaviour of Great Reed Warblers in order to be able to answer questions about the use of linear habitat patches (corridors). These data enable us to improve the dispersal module in the metapopulation model which then could be used as a powerful instrument in studying effects of fragmentation. Modelling the population dynamics incorporating all the important demographic parameters, spatially explicit, will allow predictions on long-term development or future survival chances of a population. A model, suitable for these purposes thus needs needs information on immi- and emigration rates, on (average) dispersal distances and on the effect of fragmentation on dispersal behaviour. We consider the results of this study as an important step in filling in the first gaps in the required data. We hope in the near future to be able to better understand the effects of spatial coherence of the landscape on the survival of the Great Reed Warbler and also think the results will pay off in the direction of new guidelines for a better wetland management.
ACKNOWLEDGEMENTS
The authors wish to thank the following field workers for their help in collecting the data: Leo van den Bergh, Jeroen de Bruin, Simon Deuzeman, Eric Jansen, Edwin Loos, Jan Nap, Frank de Roder, Jasper Smit and Dirk-Jan Wind. Furthermore they are grateful to Paul Chardon and Laura Bosschieter for calculating the survival estimates and helping to prepare the manuscript and to Cajo Ter Braak from the Centre of Biometry of CPRO-DLO for his indispensable statistical input. Finally, we wish to thank Andre Desrochers for his valuable comments on an earlier version of the manuscript.
REFERENCES
Bart, J. 1995. Evaluation of population trend estimates calculated using capture-recapture and population projection methods. Ecological Applications 5: 662-671.
Begon, M. 1979. Investigating animal abundance; capture-recapture for biologists. Edward Arnold Limited, London
Bensch, S.1993. Costs, benefits and strategies for females in a polygynous mating system: a study on the great reed warbler. PhD-thesis, University of Lund.
Bulmer, M. G. & Perrins, C. M. 1973. Mortality in the Great Tit Parus major. Ibis 115: 277-281.
Catchpole, C.K. 1972. A comparative study of territory in the Reed Warbler Acrocephalus scirpaceus and Sedge Warbler Acrocephalus schoenobaenus. Journal of Zoology 166: 213-231.
Cooch, E. G., Pradel, R. & Nur, R. 1996. A practical guide to mark-recapture analysis using SURGE. Centre d´Ecologie Fonctionelle et Evolutive-CNRS, Montpellier, France.
Cramp, S. & Brooks, D. 1992. Handbook of the Birds of Europe, the Middle East and North Africa, Volume VI- Warblers, Oxford University Press, Oxford.
Graveland, J. (1998). Reed die-back and the decline of the Great Reed Warbler Acrocephalus arundinaceus in the Netherlands. Ardea in press.
Finney, D. J. 1964. Statistical method in biological assay. Griffin, London.
Jackson, C. H. N. 1939. The analysis of an animal population. J. Anim. Ecol. 8: 238-246.
Lebreton, J.-D., Burnham, K. P., Clobert, J. & D. R. Anderson. 1992. Modeling survival and testing biological hypothesis using marked individuals: a unified approach with case studies. Ecological Monographs 62: 67-118.
Manly, B. F. J. 1985. A test of Jackson´s method for separating death and emigration with mark-recapture data. Res. Popul. Ecol. 27: 99-109.
Matthysen, E., Adriaensen, F. & Dhondt, A.A. 1995. Dispersal distances of Nuthatches Sitta europaea, in a highly fragmented forest habitat. Oikos 72: 375-381.
Nichols, J. D., Brownie, C., Hines, J. E., Pollock, K. H. & Hestbeck, J. B. 1993. The estimation of exchanges among populations or subpopulations. In: J.-D. Lebreton and Ph. M. North (eds.). Marked individuals in the study of bird population. Birkhauser Verlag, Bases.
Opdam, P. 1990. Dispersal in fragmented populations: the key to survival. In: Bunce, R.G.H. & Howard, D.C. (eds) Species dispersal in agricultural habitats. Belhaven press, London, New York.
Ostendorp, W. 1993. Schilf als Lebensraum. Beihefte zu den Veröffentlichungen für Naturschutz und Landschaftsplege in Baden Württemberg 68: 173-280.
Schwarz, C. J. 1993. Estimating migration rates using tag-recovery data. In: Lebreton, J.-D. & North, Ph. M. (eds) Marked individuals in the study of bird population. Birkhauser Verlag, Basel.
Van Noordwijk, A. J. 1993. On the role of ringing schemes in the measurement of dispersal. In: Lebreton, J.-D. & North, Ph. M. (eds) Marked individuals in the study of bird population. Birkhauser Verlag, Basel.
Van Noordwijk, A. J. 1995. On bias due to observer distribution in the analysis of data on natal dispersal of birds. Journal of Applied Statistics 22: 683-694.
Von Haartman, L. 1971. Population dynamics. In: Farner, D.S. & King, J.D. (eds) Avian Biology I. Academic Press, New York: 329-459.
Table 1. Number of colour-banded individuals in the study area and the core area (Ketelmeer, Zwarte Meer) during the years 1994-1996.

Table 2. Result of various mark- resighting models and comparisons between these models. For each of the models the number of estimated parameters (np), the deviance (DEV) and the Akaike information Criterium (AIC) is presented. P is the probability of resighting, f is the survival. With help of these parameters and the comparison the most parsimonious model (8) was chosen that is also ecologically sensible.
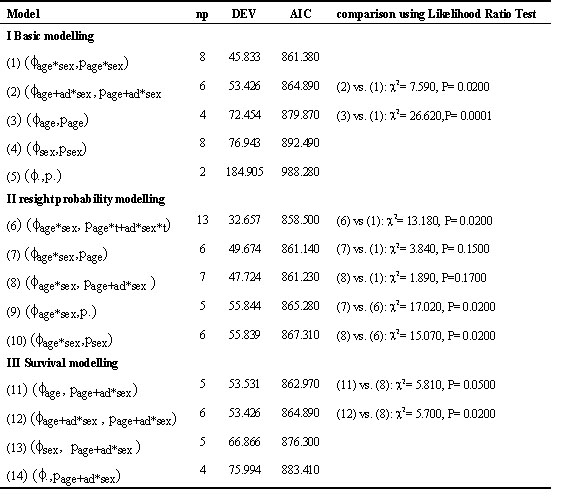
Fig. 1. Map of the study area with indication of main part
around Zwarte Meer and Ketelmeer.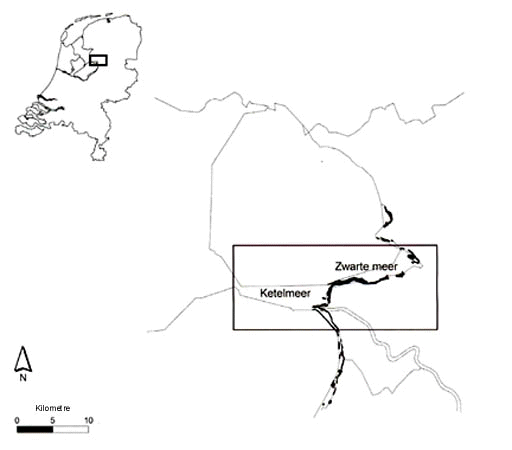
Fig. 2. Representation of the Jackson method for a square study area. The study area is divided in four equal squares. Of every individual it is known in which square it is born or has held a territory. The arrows indicate the potential directions that an individual can go.
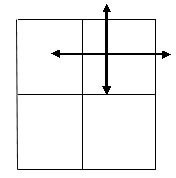
Fig. 3. Representation of the Jackson method for a rectangular study area. The arrows indicate potential dispersal directions. From one rectangular there are two emigration possibilities. From two rectangulars four possibilities; half of the emigrants stays within the two rectangulars. From three rectangulars there are six emigration possibilities: two-third of the emigrants stays within the rectangular, one-third disperses.
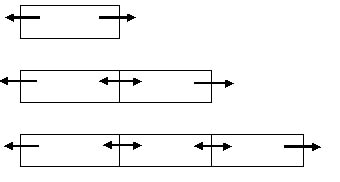
Fig. 4. Estimates for survival (a) and probability of resighting (b) for the Great Reed Warbler, cummulated effects for the years 1994-96. The lines indicate 95% confidence limits. Light bars refer to females, dark bars males.
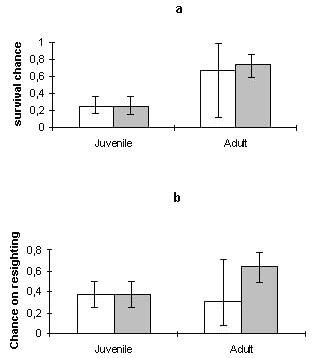
Fig. 5. Dispersal distance of individuals ringed as adult (top, n = 46) or as nestling (below, n = 73).
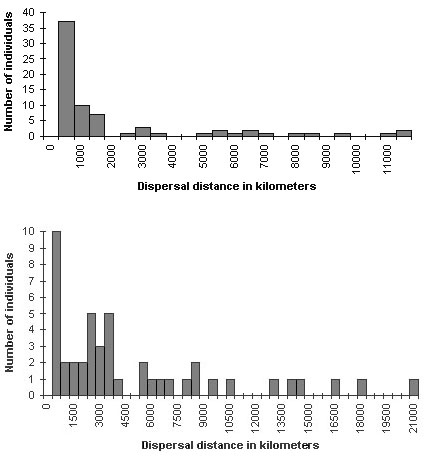
Fig. 6. Example for the emigration rate assessment for adult males. The thick line represents the regression result, the normal lines the 95% confidence limits.
