S38.2: Are Endemic Bird Areas the best targets for conservation? An assessment using all landbird distributions of two continents
Jon Fjeldså1, Neil Burgess1, Helen de Klerk2, Louis Hansen1 & Carsten Rahbek1
1Zoological Museum, Univesitetsprk. 15, DK-2100 Copenhagen, Denmark, e-mail jfjeldsaa@zmuc.ku.dk; 2Percy FitzPatritrick Inst., University of Capetown, Rondebosch 7700, South Africa
Fjeldså, J., Burgess, N., de Klerk, H., Hansen, L. & Rahbek, C. 1999. Are Endemic Bird Areas the best targets for conservation? An assessment using all landbird distributions of two continents. In: Adams, N.J. & Slotow, R.H. (eds) Proc. 22 Int. Ornithol. Congr., Durban: 2271-2285. Johannesburg: BirdLife South Africa.
We studied the adequacy and efficiency of the identification of Endemic Bird Areas by BirdLife International. This was done using distributional data for all African and South American birds and a 1° geographical resolution. The 22 African EBAs include (at least as marginal populations) 96.6% of all resident landbirds, with 85% in EBA 'core areas'. The 43 South American EBAs include 98.5% of all species, with 94.4% in the 'core areas'. The EBAs were inefficient compared with a complementarity analysis, according to which the same area gave four representations of all species for Africa, and seven for South America. However, the EBAs drew attention to areas which are of critical importance in relation to current human pressures and the location of protected areas. This is because marked local aggregates of endemic species (with neoendemic and old relict forms together) are relict and related to local environmental predictabilities. These areas, mainly in montane regions, corresponds closely to centres where human civilisations flourished in the past and where the remaining patches of natural vegetation are now under intense pressure from dense human populations. For other areas, mostly in tropical lowlands, the endemism correlates with species richness, and can probably be explained from current ecology (rainfall, habitat complexity). The protected areas network is systematically biased towards regions which have few range-restricted species and few species to loose.
INTRODUCTION
The effort by BirdLife International to analyse the distribution of all birds with a distribution of less than 50.000 km² resulted in the documentation of a highly aggregated distribution of such species (ICBP 1992, Stattersfield et al. 1998). Thus, 20% of all species on earth are confined to only 2% of the land surface. The map of 221 Endemic Bird Areas (EBAs) represents the first global analysis of conservation priorities based on hard distributional data and a consistent methodology.
Critics of the EBA approach emphasised that the arbitrary cut-off limit results in a bias towards physical islands and habitat islands, and a neglect of many widespread but endangered species and of subspecies which represent Evolutionarily Significant Units (e.g. Crowe and Brooke 1993, Kratter 1993).
A continent-wide 'gap analysis' comparing distribution ranges of South American birds with existing reserves and with low human population areas (Fjeldså & Rahbek in press) revealed that areas with high endemism in the Andes and in the Brazilean Atlantic forest indeed have the most severely underprotected communities and therefore need special attention. In the present paper we examine more explicitly how well the EBAs cover the regional avifaunas. We will use data for all resident landbird species of two tropical continents. We will also discuss what is special with places with many endemic species, and emphasise special local conditions which apparently also played a key role for the development of human cultures, thereby causing a high pressure on some of these unique ornithological communities. The question about how to make meaningful conservation priorities will be discussed on this background.
METHODS
We used the WORLDMAP computer programme. This is a PC-based graphical tool for accommodating distributional data for large numbers of species and for fast interactive assessment of priority areas for conservation (Williams 1992).
Baseline maps for South American birds were prepared over a ten-year period by R.S. Ridgely and W.L. Brown and were kindly placed at our disposal by the Academy of Natural Sciences of Philadelphia. These maps include verified records and an assumed range boundary (a consensus of several persons with long field experience in South America). We revised the maps, including the data compiled since 1977 by Danish teams (see Fjeldså and Krabbe 1990). For Africa, we used primarily the maps of Snow (1978), Hall & Moreau (1962) and in Handbook of African Birds (Fry et al. 1982-98) and added records by Danish teams working in eastern Africa since 1990 (Burgess et al. in press ab). For both continents we also included BirdLife International's data on endemic and endangered species, and data from numerous recent publications which fill in some of the collecting gaps. Range maps were made by conservative interpolation between known records where ecological maps and satellite images suggest fairly uniform habitat. However, range disjunctions are drawn to reflect negative records in well studied areas, and for species which seem to be genuinely rare and local. The data were entered in 1° grid cells (approximately 12000 km²), which we think is the finest resolution permissible considering the collecting gaps which exist in certain regions. Datasets with 15' resolution were developed for the tropical Andes region and for eastern African forest birds.
We identified species assemblies which fall outside the EBAs by pre-selecting all EBA grid-cells, which means that all species present in these cells are removed from the dataset. This was done by marking all cells which overlap with EBAs (as drawn on the maps in Stattersfield et al. 1998), excepting cells which are covered less than five per cent by a marginal zone of an EBA.
Because of a high degree of nestedness of the distributions of endemic species (see text and tables in Stattersfield et al. 1998), many EBAs consist of a distinctive core area, where all (or nearly all) the species are represented. For many EBAs which extend as a long band along the Andean slopes, the analysis of our finescale (15') dataset shows marked local peaks of endemism (Fjeldså, Lambin & Mertens in press). We also performed an analysis where only 'core areas' were pre-selected. We defined these as cells where at least 2/3 of all the restricted-range species are recorded (the definition of 'core areas' should be regarded as tentative, though, at least for some tropical lowland areas). A few EBAs include a distinctive local subset of species which satisfies the criterion for a 'core area' when viewed in isolation.
RESULTS
Africa
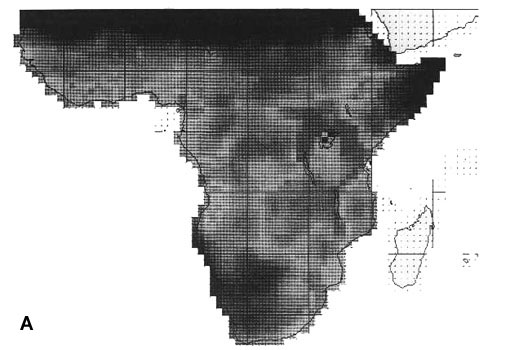
In Africa the highest levels of species richness are in the mosaics of savannas and montane habitats in eastern Africa and in the southern savanna woodlands, while the lowland rainforest regions are relatively poor (Fig. 1 A, Richards 1973). Areas with particularly high endemism (expressed as the sum of inverse range-sizes of all species present in each cell) are in the montane areas and coast of eastern Africa (down to the Cape), on the Angola Scarp, in Cameroon-Gabon and locally in the Upper Guinea Forest (Burgess et al. in press a).
22 African EBAs cover altogether 301 cells (Fig. 1 B, 15.4% of the land area), and 1686 (96.62%) of all the resident landbird species. The network missed 59 species, mainly in Sahara and the Sahel belt, and in addition a few species inhabiting Congo river islands, the Congo-Zambesi watershed, northwestern Botswana (including Okavango) and southern Namibia (up to four species), and single species in a few other places. 35 of these species would be picked up by the 23 'secondary areas', which were defined from a single restricted-range species (Stattersfield et al. 1998) (in fact three of these formed the South Zambia EBA in an earlier analysis, ICBP 1992). The 45 cells which represent EBA 'core areas' (Fig. 1 C, 2.3% of the land area) covered 1451 (75%) species. The missing 294 species represent mainly the Sahel and southern savanna avifaunas and of the northern and southern desert faunas.
By examining the South African bird atlas (Harrison et al. 1997) it seems that three species of larks would have qualified for defining a Nama Karoo EBA. This failure probably reflects insufficient knowledge about how range restricted these birds are, combined with systematic neglect of one species.
South America
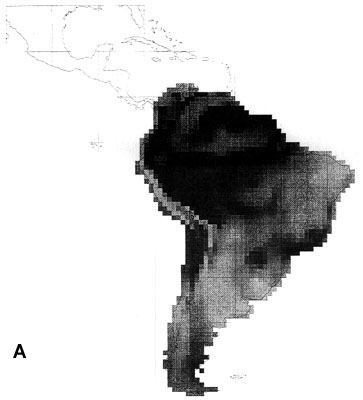
The extraordinary richness of the South American avifauna is above all due to the richness of the humid forests of the Guianas, the Amazon Basin and the tropical Andes region (Fjeldså & Rahbek 1997). Although the point diversity is highest in the sub-Andean part of the Amazon basin, the between-habitat diversity peaks on the cis-Andean slope (Fig. 2A). A full altitudinal transect may in some places have 1000 bird species or the same as entire Amazonian lowland. The endemism is strongly biased to the tropical Andes region, and is also very high in the Guiana highland and in the Brazilian Atlantic forests (Fjeldså & Rahbek 1997).
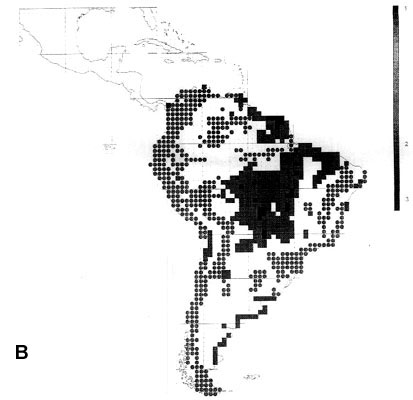
43 South American EBAs cover 531 cells (31.8% of the land area), and 2857 resident landbirds, or 98.53% of all species. They missed only 42 species, mainly at the Guiana coast and in the Brazilian Cerrados, and very few species elsewhere. 14 of these species would be picked up by including the 19 'secondary areas' (which actually include the West Amazonian and East Bolivian EBAs recognised by an earlier analysis, ICBP 1992).
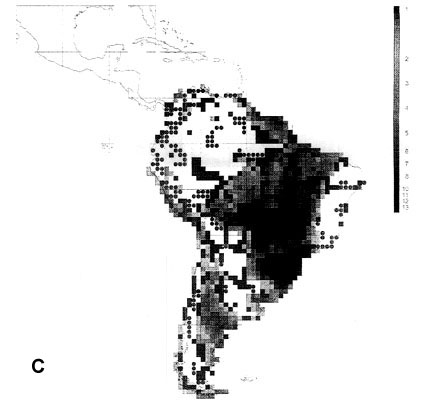
142 cells defined as 'core areas' (8.5% of the land area) contained 2697 species (94.4%). They missed 151 species, mainly in Guiana and the northeast Brazilian coast, the Brazilian highland (maximum 12 uncovered species in Planalto de Mato Grosso) and the southern Atlantic forests (Parana), and also along the arid diagonal from the Peruvian desert to Río Negro and Chubut in Argentina.
Comparison with complementarity analysis
In order to find out how efficient EBAs are, in terms of species per area covered, comparisons were made with a computer analysis identifying the a near-minimum set of complementary areas needed to cover all species (see Williams et al. 1996). All African birds could be covered in only 89 1° cells. Of these, 45 overlap with EBAs and 21 with 'core area' cells, but the overlap is actually better than this if we consider the flexibility inherent in near-minimum sets. A set of complementary areas providing three representations of every species can be achieved with 236 cells, and four representations with 306 cells. These values should be compared with the 301 EBA cells needed to cover 96.2% of the species in at least one cell (but of course many species are covered in many more cells).
For South America, the minimum set comprises 299 cells. Of these, 197 overlap with EBAs and 90 with 'core areas' cells. A set of complementary areas providing four representations of every species can be achieved with 359 cells. Five representations require 424 cells, six representations 488 cells and seven representations 540 cells. This latter value should be compared with 531 EBA cells covering 98.53% of the species in at least one cell.
DISCUSSION
Despite the high species richness of many areas which are not part of the EBA network, the far majority of species are in fact covered by EBAs, at least marginally. If we consider also the 'secondary areas' (characterised by a single local endemic), the BirdLife approach identified areas which would provide an almost complete coverage of the two tropical avifaunas studied. This is by far a more meaningful way of making conservation priorities than the Megadiversity Country approach (Mittermeier 1988), Species Richness Hotspot approach (Myers 1990) or Ecoregion approach (Dinerstein et al. 1995).
However, as an EBA covers several adjacent cells with almost the same species assortment, the approach is not particularly area effective, at least not for Africa. A complementarity analysis is much more efficient in terms of maximising the number of species per area unit. Complementarity analysis also provides a high flexibility in terms of optimisation in relation to existing protected areas networks and different threat levels, or development scenarios (see Fjeldså & Rahbek in press).
Rather than discussing EBAs only from a viewpoint of statistical optimization of picking specific products of the evolutionary process, we will consider now whether EBAs make sense for maintaining the processes which sustain biodiversity. We now need to consider what is special about places with high endemism. This requires that we review some recent studies of historical and ecological causes of large-scale variation in biodiversity.
Lowland areas
The diversification of tropical forest biota has for a long time been discussed mainly in relation to Pleistocene climatic-vegetational changes. These are now known to result from a general global cooling since the upper Tertiary, and orbital forcing, as the last 8-900.000 years were characterised by a strong impact of 100.000-years eccentricity cycles with a periodically strong impact of south polar winds into the tropics (Shackleton et al. 1990, Servant et al. 1993, deMenocal 1995). It is widely believed that the repeated isolation of forest dependent taxa in remaining forest refuges was a principal cause of speciation (Haffer 1974, Diamond & Hamilton 1980; Kingdon 1989 for a popular overview).
In contrast to this view, the relatively low biological diversity of the present tropical forests (compared with the Tertiary 'Super Rain Forest', Flenley in press), would suggest that the tropical forests were impoverished and not diversified during the Pleistocene. The regional variation in species richness could therefore reflect how ancient species survived in spite of the Pleistocene eco-climatic disturbance. Fjeldså (1994) and Fjeldså & Lovett (1997), using the DNA hybridisation data (Sibley & Ahlquist 1990), found that lowland rainforests and floodplains are characterised mainly by species representing lineages of pre-Pleistocene age. Pleistocene proliferation of species were more characteristic of uplands and montane cloudforests. This is supported also by studies using well resolved phylogenies for smaller groups (e.g. Roy et al. in press).
94% of the variation in endemism in the Guineo-Congolian rainforest can be explained from the variation in species richness (Fjeldså et al. in press; we expect that a similar correlation will also be found for most of the Amazon rainforest and for large portions of the savannas and drier regions of the two continents, although appropriate statistical tests have not yet been made). Given the empirically documented variation in range-sizes and rank-abundance relationships in communities (Gaston 1994), it follows that areas with many species must necessarily also have most rare and local species. This can be exemplified by the avifauna of the Amazon flooded forests (especially Manaus to Santarem). This area has up to 617 species per cell (against a general level of 4-500 species in the mid- and lower Amazon area), with many isolated local populations of species which are more widespread in the upper Amazon or in the Guianan lowlands. This richness peak correlates with a high level of functional heterogeneity of landscapes (J.Fjeldså & E.Lambin, unpublished data). Thus, the existence of four narrowly endemic species (Stattersfield et al. 1998) is hardly more than what could expect in such a 'richness hotspot'. The same applies to the endemism of the Argentine Mesopotamian grasslands, Upper Amazon-Napo lowlands, some humid sub-Andean ridges, and the Upper Guinea, Gabon and eastern Zaïre forests. Unless evidence is provided for a consistent biogeographic signal there is no particular reason to invoke historical explanations for such 'hotspots'.
Although tropical lowland faunas provide examples of some recent speciation related to, e.g. special habitats, rivers or tectonic changes affecting floodplain areas (Kalliola et al. 1993), the biodiversity of these regions seem, above all, to reflect enormous time spans for accumulation of species, and enormous areas. Because of the wide distributions, the far majority of species are well covered by the protected areas that already exist in the non-arable or non-inhabitable parts of these regions (Fjeldså & Rahbek in press).
Montaneous regions
No less the 20 EBAs, representing distinctive subsets of endemic species can be recognised within the huge Andean area of endemism (Fig. 2B). The high level of endemism would, at a first glance, seem to be a simple consequence of the many isolating barriers. A closer examination reveals, however, that several range-restricted forest birds inhabit opposite sides of valleys which would seem to represent dispersal barriers. Such observations, together with a nested distribution of neoendemics and old relict forms (Fjeldså 1995, Fjeldså & Lovett 1997; tables in Stattersfield et al. 1998), that the endemism is driven by high levels of extinction outside specific, narrow 'core areas' rather than by the barriers (see also Schneider & Williams in press). Several molecular studies suggest that bottleneck effects play an important role in the diversification process (e.g. García-Moreno & Fjeldså in press). Remotely sensed data provide direct evidence for linking peaks of endemism to local stability in surface conditions (Fjeldså et al. 1997, Fjeldså et al. in press b). Thus, narrow endemism in the Andes is to a large extent associated with orographic protection against south polar winds. Presently manifest as occasional winter freezes, such winds may have been a major determinant of vegetational changes during Pleistocene glacial periods. Similarly, the peak concentrations of endemics at the African Cape and in the Namib-Karoo fall within a narrow (but geologically complex) zone characterised by long-term stability along the borderline of areas with summer and winter rains (Goldblatt 1997, Jürgens 1997).
Nearly all places in the tropics with marked aggregates of endemic species are under intense pressure from human populations, and were cultural centres where human civilisations flourished in the past. This is the case for the lowlands adjacent to the Cameroon Mts. (Igbo and Benin cultures), Albertine Rift (Nkena, Rwanda, Burundi and Buganda), in the Nyasa-Tanganyika Mts (Kliwa, Fipa, Hehe) and adjacent coast (Swahili), in western Zimbabwe (Great Zimbabwe) and Ethiopia (Aksum). It is also the case in the Andes, notably for the Santa Marta area of northern Colombia, the Tumbes region and the Andean Chavín, Huari, Inca and Tiahuanuco centres (Fjeldså & Rahbek 1998 and in press). Also the Brazilian Atlantic coast was densely populated since pre-Colombian times. The correlation can be remarkably precise: exceptional aggregates of rare birds are found in the tiny forest remnants on high ridges right above the Sacred Valley of the Incas. Because of the fairly consistent pattern across two continents, we do not think that this is a coincidence but rather a consequence of persistently favourable local conditions.
We suggest that the long human history in areas with high endemism is related mainly to resource predictability. This comprises local moderation of extreme weather and a steady supply of water from high ridges where a mossy and microphyllic forest 'combs' moisture out of the wind-driven mist. Fertile soils develop locally, on the transition to rainshadow areas where there is a balance between rainfall and evaporation (Holdridge 1967), and in volcanic areas.
Conservation perspectives
Existing conservation strategies (e.g. Stuart et al. 1990 and Sayer et al. 1992 for Africa, Dinerstein et al. 1995 and Harcourt & Sayer 1996 for South America) focus on regions of high biodiversity and on the protected areas network. Unfortunately, this network was not planned in a way which explicitly considered patterns and processes such as those discussed above (Pressey & Tulley 1994, Fjeldså & Rahbek in press). The ad hoc approach of reserving areas where there are few people (and therefore low conflict levels) actually means spending conservation resources in areas which have few species to loose. To a large extent, reservation of areas with virtually no people leads to redundant conservation of the widespread and adaptable species which are characteristic of ecologically unstable regions.
We will not dispute the value of having large areas of lowland rainforests and tropical swamps, or the role of proactive reservation for protecting the African megafauna. However, because the species pools are partly a consequence of dynamic landscape processes acting over enormous areas, their global persistence is indeed possible despite considerable amounts of local elimination. We suggest that more can probably be achieved now in these regions by wise macropolitical decisions than by traditional reserving. High priority is needed to improving international agreements on climate, tariffs and trade (notably of timber), on removing perverse subsidies and providing suitable land tenure policies. On the more local scale, economic planning should be promoted which helps people establish stable communities with access to stable external markets, as opposed to uncontrolled and opportunistic colonisation following the construction of new roads into the rainforest.
The network of protected areas cover only few 'core areas' of endemism (Fjeldså & Rahbek 1997). These are threatened (now as in the past) by dense traditional rural populations which have few alternatives (as exemplified by the overpopulation in Rwanda-Burundi, and the totally converted landscapes in the montane basins of the tropical Andes region). Many areas which may initially have been covered by species rich montane forests have now been turned into eroded and dry wastelands. In some districts so little cloudforest is left that important water catchment functions may have been lost. Although the cost of protecting EBA 'core areas' will be high, investments to protect tiny local forest patches are indeed relevant, since they will maintain ecosystem functions which are also good for people. The approach needs not necessarily rest on traditional nature protection: it may be even more efficient to provide massive assistance to help local communities to better landuse.
The EBAs drew attention to some areas where actions to prevent species extinctions are urgently needed. However, the approach was not particularly precise. Much higher area efficiency and analytic flexibility can be achieved today by a complementarity analysis. We see the identification of EBAs as a major step forwards, which now needs to be replaced by studies which identifies precise sites for conservation actions. We will emphasize that analyses of distributional data for large numbers of species, using the principles of complementarity, and various information about current opportunities and threats, and development scenarios, will become necessary for targeting conservation efforts in the best possible way.
ACKNOWLEDGMENTS
The Danish Center for Tropical Biodiversity (Danish Natural Science Research Council grant 11-0390) provided an excellent environment for interdisciplinary studies and for compiling the datasets upon which this paper is based. The development of the African distributional databases were organised by Neil Burgess, with a joint effort with the Percy FitzPatrick Institute on the bird dataset. The development of the South American database was organised by Carsten Rahbek, and was possible thanks to a collaboration with the Philadelphia Academy of Natural Sciences. BirdLife International placed their data on rare and endemic species at our disposal. For data entry the main responsible persons were Casper Paludan and Louis Hansen, who also prepared the datasets for the present analysis.
REFERENCES
Berger, A., Imbrie, J., Hays, J., Kukla, G. & Salzman, B. (eds) 1984. Milankovitch and climate. Reidel, Dortrecht.
Burgess, N., de Klerk, H., Fjeldså, J. & Rahbek, C. In press a. A preliminary assessment of congruence between biodiversity patterns in Afrotropical forest birds and forest mammals. Ostrich.
Burgess, N., Fjeldså, J. & Botterweg, R. In press b. The faunal importance of the Eastern Arc Mountains in Kenya and Tanzania. J. East African Nat. Hist. Soc.
Crowe, T.M. & Brooke, R.K. 1993. A review: Putting biodiversity on the map: priority areas for global conservation. Ostrich 64: 12.
deMenocal, P.B. 1995. Plio-Pleistocene African climate. Science 270: 53-58.
Diamond, A.W. & Hamilton, A.C. 1980. The distribution of forest passerine birds and Quaternary climatic change in Africa. J. Zool. Lond. 191: 379-402.
Dinerstein, E., Olson, D.M., Graham, D.J., Webster, A.L., Primm, S.A., Bookbinder, M.P. & Ledec, G. 1995. A conservation assessment of the terrestrial ecoregions of Latin America and the Caribbean. Washington, D.C., World Bank, 140 pp.
Fjeldså, J. 1994. Geographical patterns of relict and young species of birds in Africa and South America and implications for conservation priorities. Biodiver. Conserv. 3: 107-226.
Fjeldså, J. 1995. Geographical patterns of neoendemic and older relict species of Andean forest birds: the significance of ecologically stable areas. In S.P. Churchill et al. (Eds) Biodiversity and Conservation of Neotropical Montane Forests, New York Bot. Garden: 89-102.
Fjeldså, J. & Krabbe, N. 1990. Birds of the High Andes. Apollo Books, Svendborg, and Zoological Museum, Copenhagen, 890 pp.
Fjeldså, J. & Lovett, J.C. 1997. Geographical patterns of phylogenetic relicts and phylogenetically subordinate species in tropical African forest. Biodiver. Conserv. 6: 325-346.
Fjeldså, J., Ehrlich, D., Lambin, E. & Prins, E. 1997. Are biodiversity 'hotspots' correlated with current ecoclimatic stability? A pilot study using the NOAA-AVHRR remote sensing data. Biodiversity and Conservation 6: 401-422.
Fjeldså, J., Lambin, E. & Mertens, B. in press. Correlation between endemism and local ecoclimatic stability documented by comparing Andean bird distributions and remotely sensed land surface data. Ecography.
Fjeldså, J. & Rahbek, C. 1997. Species richness and endemism in South American birds: implications for the design of networks of nature reserves. In: Laurance, W.F. & Bierregaard, R.O. (eds) Tropical forest remnants. Ecology, management, and conservation of fragmented communities. Chicago, Chicago Univ. Press: 466-84.
Fjeldså, J. & Rahbek, C. In press. Continent-wide diversification processes and conservation priorities. In: Mace, G.M., Balmford, A. & Ginsberg, J.R. (eds) Conservation in a changing world. Cambridge, U.K., Cambridge Univ. Press.
Flenley, J. In press. Palyno-diversity and the super rainforest. In: Moritz, C. (ed.) Tropical Rainforests: Past and Future.
Fry, C.H., Keith, S. & Urban, E.K. 1982-98. The birds of Africa, Vols 1-6. London: Academic Press.
García-Moreno, J. & Fjeldså, J. In press. A re-evaluation of species limits in the genus Atlapetes based on mtDNA sequence data. Ibis.
Gaston, K.J. 1994. Rarity. London, Chapman & Hall, 205 pp.
Haffer, J. 1974. Avian speciation in tropical South America. Publs. Nuttal ornithological Club 14: 1-390.
Hall, B.P. & Moreau, R.E. 1970. An atlas of speciation in African passerine birds. London: British Museum (Natural History), 423 pp.
Harrison, J.A., Allan, D.G., Underhill, L.G., Herremans, M., Tree, A.J., Parker, V. & Brown, C.J. 1997. The atlas of southern African birds. Johannesburg, BirdLife South Africca, 2 vols, 785 and 726 pp.
Goldblatt, P. 1997. Floristic diversity in the Cape flora of South Africa. Biodiver. Conserv. 6: 359-377.
Harcourt, C.S. & Sayer, J.A. 1996. The conservation atlas of tropical forests. The Americas. Simon & Schuster, New York.
Holdridge, L.R. 1967. Life Zone Ecology. San Jose, Costa Rica, Tropical Science Center.
ICBP. 1992. Putting biodiversity on the map: priority areas for global conservation. Cambridge, UK, International Council for Bird Preservation.
Jürgens, N. 1997. Floristic biodiversity and history of African arid regions. Biodiver. Conserv. 6: 495-514.
Kahn, J.R. & McDonald, J.A. 1997. The role of economic factors in tropical deforestation. In: Laurance, W.F. & Bierregaard, R.O. (eds) Tropical Forest Remnants. Chicago, Chicago Univ. Press: 13-28.
Kalliola, R., Puhakka, M. & Danjoy, W. 1993. Amazonia Peruana. Lima, ONERN: 265 pp.
Kingdon, J. 1989. Island Africa. The evolution of Africa's rare animals and plants. Princeton, N.J.: Princeton Univ. Press, 287 pp.
Kratter, A.W. 1993. Review of [Putting biodiversity on the map: priority areas for global conservation]. Auk 110: 423-4.
Mittermeier, R.A. 1988. Primate diversity and the tropical forest. Case studies from Brazil and Madagascar and the importance of the megadiversity countries. In: Wilson, E.O. (ed.) Biodiversity. Washington, D.C., National Academy Press: 145-54.
Myers, N. 1990. The biodiversity challenge: expanded hot-spot analysis. Environmentalist 10: 243-56.
Pressey, R.L., Humphries, J.J., Margules, C.R., Vane-Wright, R.I. & Williams, P.H. 1993. Beyond opportunism: key principles for systematic reserve selection. Trends in Ecology and Evolution 8: 124-128.
Pressey, R.L. & Tully, S.L. (1994) The cost of ad hoc reservation: a case study in western New South Wales. Austr. J. Ecol. 19: 375-384.
Richards, P.W. 1973. Africa, the 'Odd Man Out'. In: Meggers, B.J., Ayensu, E.S. & Duckworth, W.D. (eds) Tropical Forest Ecosystems in Africa and South America. Washington, D.C., Smithsonian Inst. Press: 21-6.
Roy, M.S., Arctander, P. & Fjeldså, J. In press. Speciation and taxonomy of montane greenbuls of the genus Andropadus (Aves: Pycnonotidae). Steenstrupia.
Sayer, J.A., Harcourt, C.S. & Collins, N.M. 1992. The conservation atlas of tropical forests. Africa. Cambridge, WCMC, 288 pp.
Servant, M., J. Maley, B. Turcq, M-L. Absy, P. Brenac, M. Fournier & M-P. Ledru. 1993. Tropical forest changes during the Late Quaternary in African and South American lowlands. Global and Planetary Change 7: 25-40.
Shackleton, N.J., Berger, A. & Peltier, W.R. 1990. An alternative astronomical calibration of the lower Pleistocene timescale based on ODP Site 677. Transactions of the Royal Society of Edinburgh: Earth Sciences 81: 251-261.
Sibley, C.G. & Ahlquist, J.C. 1990. Phylogeny and classification of birds. Yale Univ. Press, New Haven: Yale Univ. Press, 796 pp.
Snow, D.W. (Ed.). 1978. An atlas of speciation in African non-passerine birds. London: British Museum (Natural History), 390 pp.
Stattersfield, A.J., Crosby, M.J., Long, A.J. & Wege, D.C. 1998. Endemic Bird Areas of the World. Priorities for Biodiversity Conservation. Cambridge: BirdLife International, 846 pp.
Stuart, S.N., Adams, R.J. & Jenkins, M.D. 1990. Biodiversity in Sub-Saharan Africa and its Islands. Conservation, Management, and Sustainable Use. Gland, IUCN.
Williams, P., Gibbons, D., Margules, C., Rebelo, A., Humphries, C. & Pressey, R. 1996. A comparison of richness hotspots, rarity hotspots and complementary areas for conserving diversity using British birds. Conservation Biology 10: 155-174.
Fig. 1. Richness of resident African landbirds. (A) species richness variation for all 1745 species in 1° grid cells; (B) richness of 59 species which were not covered by 301 cells representing the EBAs; (C) richness of 294 species which were not covered by 45 cells representing EBA 'core areas'.

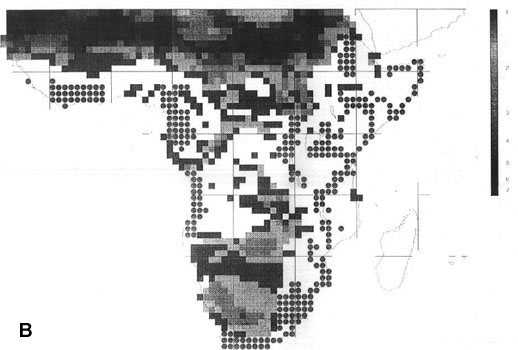
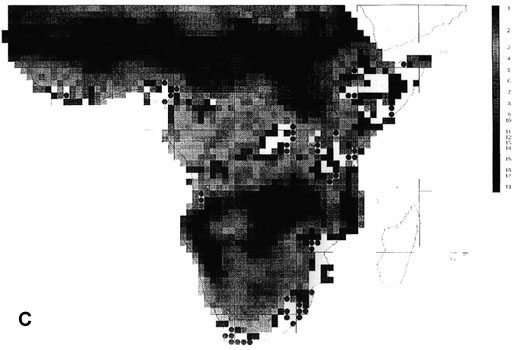
Fig. 2. Richness of resident South American landbirds. (A) species richness variation for all 2899 species in 1° grid cells; (B) richness of 42 species which were not covered by 531 cells representing the EBAs; (C) richness of 51 species which were not covered by 142 cells representing EBA 'core areas'.
