S32.4: Demographic inferences from coalescent patterns: mtDNA sequences from a population of Mexican Spotted Owls
George F. Barrowclough & Jeffrey G. Groth
Department of Ornithology, American Museum of Natural History, Central Park West at 79th Street, New York, New York, 10024, USA, fax 212 769 5785, e-mail jgg@amnh.org
Barrowclough, G. F., & Groth, J. G. 1999. Demographic inferences from coalescent patterns: mtDNA sequences from a population of Mexican Spotted Owls. In: Adams, N.J. & Slotow, R.H. (eds) Proc. 22 Int. Ornithol. Congr., Durban: 1914-1921. Johannesburg: BirdLife South Africa.Recent advances in DNA technology have made it possible to obtain relatively large numbers of sequences for intraspecific problems, including those associated with gene flow and population structure. Coalescent theory, applied to these sequences, enables one to draw inferences about the temporal history of demographic parameters for populations, including population size and gene flow. In this paper, we illustrate two approaches to addressing questions about temporal changes in population size of a population of Mexican Spotted Owls, using pairwise difference distributions and log lineage plots.
INTRODUCTION
Twenty-five years ago there was a great debate among population geneticists as to whether the extensive amounts of genetic variation being uncovered in natural populations-using the newly available technique of gel electrophoresis and specific isozyme staining-was evolutionarily adaptive or selectively neutral (Lewontin 1974); this debate extended to variation in birds (Barrowclough et al. 1985). Today, with the wide availability of DNA sequencing technology, it has become clear that there is a great quantity of genetic variation present within populations that is of little selective importance given actual effective population sizes. For example, it is possible to sequence portions of the mitochondrial genome of birds and have the ratio of the number of different DNA sequences (haplotypes) to the number of individuals be large, and in some studies approach a value of one. This variation offers an excellent opportunity for population and evolutionary biologists because the quantity and distribution of genetic variation within populations, in the absence of selection, is determined purely by demographic processes. Thus, information about the history of such population parameters as size (Ne) and movement (gene flow) are encoded in genetic variation; the problem is how to recover this information. Coalescent theory, the subject of this symposium, has this potential and has revolutionised the field of evolutionary genetics of natural populations.
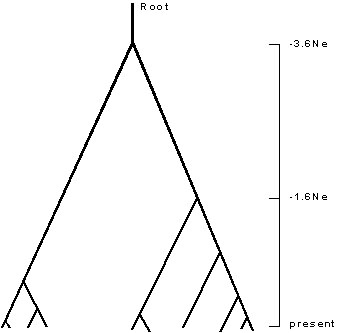
The development of coalescent theory over the past fifteen years has provided a rich set of new tools to researchers interested in demography, geographic variation, intraspecific systematics, and speciation. The basic mathematics of the coalescent were developed by Kingman (1982). A reasonably intelligible summary can be found in Hudson (1990). If the number of individuals within a species is finite and if the species is monophyletic, then all copies of genes within that species must trace to a common ancestor. If the various copies of the gene in different individuals are selectively equivalent, then the pattern of descent of the copies of the gene from one generation to the next is the result of a simple stochastic process that can be modelled and which has some simple expectations. Kingman's equations describe the expected pattern of this ancestry for a sample of genes drawn from such a finite population. If the actual size, Ne, of the sampled population is known, then the times in the past at which multiple lineages should coalesce into fewer ones can be estimated (Fig. 1).
In some sense, then, coalescent theory provides us with benchmarks for the topology of expected lineage relationships within species, something like the way in which Hardy-Weinberg expectations provide us with benchmarks for the frequencies of genotypes within finite populations. Further refinements in the theory that are of interest to evolutionary biologists are the development of expected patterns of topological relationships when the assumptions of finite, closed populations of constant size are relaxed. For example, it is now known how bottlenecks of population size, patterns of gene flow, and population expansion will affect the expected coalescent results.
Of course, none of this body of theory would be of any empirical interest if it were not for the fact that it has recently become possible to infer the topological relationships among individuals within a population, that is, to have empirical results to compare with the theoretical expectations. However, within the last ten years it has become possible to use DNA sequencing techniques to recover homologous DNA sequences from numerous individuals within species with sufficient variation and resolution that a ‘pedigree’ can be inferred using the same techniques that are routinely used to infer the phylogenetic relationships among species and higher taxa. This requires that the DNA sequences be obtained from rapidly evolving, usually, mitochondrial genes. In addition, in order to have much resolution in the pedigree, it is essential to obtain relatively long sequences. In our own laboratory, therefore, a typical study of this sort might involve on the order of five to ten individuals per population for ten or more populations; one thousand to fifteen hundred or more nucleotides would be sequenced for all of these individuals.
Once DNA sequences have been obtained, inferences can be drawn based on statistics derived from the differences among the individual haplotypes and also from the inferred tree of relationships among the sequences. The latter tree is obtained using the standard techniques of higher level systematics (e.g. Swofford et al. 1996).
In this brief introduction to the use of coalescent methods, we will describe how the results of such an analysis for a single population sample of Mexican Spotted Owls Strix occidentalis lucida fits the expected pattern for a population that has been stable in size for a long period of time. Other papers in this symposium will treat more complicated situations with complex changes in population size over time and temporal variation in patterns of dispersal (gene flow).
THEORY AND RESULTS
Pairwise differences
Populations that have been approximately constant in size for an evolutionarily long period of time will have a characteristic pattern of topology similar to that shown in Fig. 1. The amount of time separating two present day sequences varies depending upon how far back the path must go to a common ancestor. This time increases geometrically as the most recent common ancestor becomes more basal. Thus, for constant population size, the distribution of the amount of time, and hence the number of DNA substitutions, between all pairs of samples will be characterised by a series of peaks. For example, the number of differences between pairs of samples taken from the same side of the tree in Fig. 1. will be considerably less than will be the differences between pairs of samples representing both sides of the tree. Harpending (1994) has described the expected distribution of such pairwise differences as ‘ragged.’ On the other hand, if a population has been growing exponentially for a long period of time, then the resulting coalescent tree will have basal nodes that are close together, not further and further apart (Slatkin & Hudson 1991); for such a population, the distribution of pairwise differences is expected to resemble a Poisson distribution. Consequently, the distribution of pairwise differences, sometimes called the mismatch distribution, can be used as a means to recover the demographic history of a population. Of course, the history disappears for times older than about 4Ne generations, the point at which all the lineages have coalesced into a single root lineage.
The molecular genetics of Spotted Owls have been investigated using direct DNA sequencing of the mitochondrial control region (Barrowclough et al. 1999). Included in that study was a sample of ten individuals from a population just south of Flagstaff, Arizona, United States. We took the 1105 base pairs reported for those individuals and constructed the minimum spanning network of relationships among the seven haplotypes found for the sample of ten (Fig. 2). The distribution of the pairwise differences among the individuals sampled is shown in Fig. 3; it appears to be ragged or bimodal. Note that this is the distribution among the sampled individuals, not haplotypes; the six comparisons at a difference value of zero correspond to comparisons among the four owls sharing the same haplotype.
It may be useful to compare this pairwise distribution to some expectations. Unfortunately, in the case of the expectation for a population of constant size this is not easily done. The distribution of the pairwise differences is expected to be geometric; however, as Slatkin & Hudson (1991) have pointed out, this is the expectation over a large number of replicates. In practice we usually sample only a single gene from a single population and thus sample only one coalescent topology. It is this single sample that leads to a ragged distribution. However, the expected distribution for a single sample from a growing population can be estimated; it is approximately Poisson (Slatkin & Hudson 1991). Therefore, we can compare our observed distribution to an expected Poisson distribution with the same mean sequence divergence, in the case of the owls, 4.40 substitutions. In particular, for a Poisson distribution, the expected fraction of observations of value X given a mean of l is e-l
l x/x!. For example, the expected fraction of the distribution of differences equalling six substitutions, given an overall mean of 4.4 substitutions, is e-4.44.46/6!, or 0.1237. Because there is a total of 45 pairwise comparisons among ten individuals, there should be 45*0.1237, or approximately 5.6, pairwise differences of six substitutions for the expected Poisson. In Fig. 3, we have superimposed this Poisson distribution on the observed distribution. They are quite dissimilar; an actual test statistic can easily be constructed using a one-sample Kolmogorov-Smirnov test, but - because the pairwise comparisons are highly interdependent - the degrees of freedom is not easily determined. It is better to treat the observed and expected distributions as a rough comparison. More precise tests, determined by the precise geometry of the coalescent tree using Chi-square comparisons can be found in the literature. In our case, the distribution of pairwise differences suggests that this population of owls from Arizona has been approximately constant in size for thousands of years, that is, for approximately two times the female population size times the generation time.Log lineages
An alternative methodology for investigating the history of population size changes makes use of the expectation of coalescent times (Nee et al. 1995). For example, rearranging Hudson's (1990) equations, we can show that for a sample from a stationary population the expected time between coalescent events is T(j) = 4Ne/j(j-1), and the total coalescent time for a sample of n individuals drawn from a population is 4Ne(1-1/n). That is, a sample of genes from ten owls should coalesce to the root lineage at 3.6Ne generations in the past. The period of time during which there are two lineages expected to be segregating, T(2), is 4Ne/2, or 2Ne. In this fashion, we can compute the successive times in the past at which lineages should disappear into more inclusive ancestors; for a sample of size ten, ten lineages should collapse into nine at 0.04Ne generations, into eight at a total of 0.1Ne generations, etc. Omitting the factor of Ne, the expected total progression is 0.04, 0.10, 0.17, 0.27, 0.40, 0.60, 0.93, 1.60, and 3.6; that is, for example, T(10)+T(9)+T(8)=0.17Ne, etc. Nee et al. (1995) suggested that this series of decreasing times could be plotted versus the logarithm of the number of lineages; for a stationary population there will be a characteristic concave pattern. Simulations suggested that for an exponentially growing population, a convex pattern would obtain. Empirical results can be placed on the same plot as the expected coalescent pattern as a means of inferring temporal aspects of population size change, provided that a calibration point can be estimated.
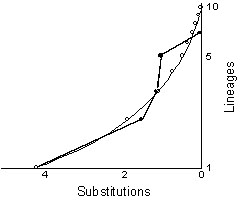
The network of relationships among the haplotypes shown in Fig. 2 can be redrawn as a coalescent tree (Fig. 4). In order to draw a log lineage plot, we need to estimate the age of each node. We can get an approximate estimate of this age by assuming that substitutions are roughly proportional to time, and computing averages over branches. For example, node B is the point at which three lineages collapse into an ancestor; those lineages are estimated to be zero, one, and two substitution events in duration. Our best estimate, therefore, is that node B represents a point (0+1+2)/3, or 1 substitution ago. Node A is estimated to be (1+2)/2 or 1.5 substitutions ago. Node E corresponds to the time of origin of four lineages that are identical given the sequences on hand; our best estimate of the age of this node is zero; it corresponds to the present. The age of node C is estimated by generalising the averaging described above such that all terminal sequences get equal weight; node C represents the coalescent of one lineage to four terminals along which there has been no divergence, one lineage that has three substitutions along it, and one lineage to three terminals-coming from node B-that have an average of one plus one, or two total substitutions. Thus, the age of node C is estimated as (4*0+1*3+3*2)/8, or 1.125 substitutions. Using the same logic, node D represents a point in time (2*4.5+8*4.125)/10, or 4.2 substitutions in the past. Because node D corresponds to the coalescence of all ten sampled individuals, its expected time of occurrence is 3.6Ne generations ago. If the mutation rate is m substitutions per generation, then 3.6m Ne = 4.2 substitutions; therefore we can calibrate the expected and observed log lineage versus time plot by letting node D and 3.6Ne both occur at 4.2 substitutions and scale the expected values for coalescent events with constant population size accordingly. In this fashion we obtain Fig. 5.
The qualitative fit of the observed and expected distributions of lineages versus time (or substitutions) is reasonably good, and quite unlike the convex curves found by Nee et al. (1995) in their simulations of exponentially growing populations. Of course, time and the number of segregating lineages is known with poor accuracy close to the right hand axis due to stochastic errors associated with the small number of changes along the most recent portions of the tree. Nevertheless, this analysis, based on the expectation of coalescent times, agrees with the pairwise difference distribution analysis and suggests that the population of Mexican Spotted Owls we sampled has been roughly constant in size for many thousands of years.
DISCUSSION
We have used two simple visual approaches arising out of coalescent theory to investigate the demographic history within a single population of owls. Statistical tests associated with these techniques can be found in the literature (e.g., Zink 1997) and in other papers in this symposium. The problem of using coalescent methods for historical inference of gene flow among populations is treated elsewhere in this symposium by Baker & Marshall (1999), and Randi et al. (1999).
ACKNOWLEDGMENTS
This research would not have been possible without the help of many field workers who provided blood samples taken from owls during their own demographic studies; we are grateful to all of them and especially to Rocky Gutiérrez, the principal investigator of the Tularosa project. Financial support for this research has been provided in part by the U.S.D.A. Forest Service (COOP. No. 28-C4-823), the Leonard J. Sanford Trust, and the Lewis B. and Dorothy Cullman Program in Molecular Systematics Studies at the American Museum of Natural History and the New York Botanical Garden.
REFERENCES
Baker, A.J., & Marshall, H.D. 1999. Population divergence in Chaffinches (Fringilla coelebs) assessed with control-region sequences. In: Adams, N.J. & Slotow, R.H. (eds) Proc. 22 Int. Ornithol. Congr., Durban: 1899-1913. Johannesburg: BirdLife South Africa.
Barrowclough, G.F., Gutiérrez, R. J., & Groth, J.G. 1999. Genetic structure of spotted owl (Strix occidentalis) populations based on mitochondrial DNA sequences. Evolution in press.
Barrowclough, G.F., Johnson, N. K., & Zink, R.M. 1985. On the nature of genic variation in birds. Current Ornithology 2: 135-154.
Harpending, H.C. 1994. Signature of ancient population growth in a low-resolution mitochondrial DNA mismatch distribution. Human Biology 66: 591-600.
Hudson, R.R. 1990. Gene genealogies and the coalescent process. Oxford Surveys in Evolutionary Biology 7: 1-44.
Kingman, J.F.C. 1982. The coalescent. Stochastic Processes and their Applications 13: 235-248.
Lewontin, R.C. 1974. The genetic basis of evolutionary change. New York; Columbia University Press: 346pp.
Nee, S., Holmes, E.C., Rambaut, A., & Harvey, P.H. 1995. Inferring population history from molecular phylogenies. Philosophical Transactions of the Royal Society of London, B. 349: 25-31.
Randi, E., Lucchini, V., & De Marta, P. 1999. Evolution of the mitochondrial control-region in populations of galliforms (Alectoris, Tetrao, and Lagopus). In: Adams, N.J. & Slotow, R.H. (eds) Proc. 22 Int. Ornithol. Congr., Durban: 1873-1880. Johannesburg: BirdLife South Africa.
Slatkin, M., & Hudson, R.R. 1991. Pairwise comparisons of mitochondrial DNA sequences in stable and exponentially growing populations. Genetics 129: 555-562.
Swofford, D.L., Olsen, G.J., Waddell, P.J., & Hillis, D.M. 1996. Phylogenetic inference. In: Hillis, D. M., Moritz, C., & Mable, B. K. (eds) Molecular systematics. 2nd edition; Sunderland, Massachusetts; Sinauer Associates: 407-514.
Zink, R.M. 1997. Phylogenetic studies of North American birds. In: Mindell, D. P. (ed) Avian molecular evolution and systematics. San Diego; Academic Press: 301-324.
Fig. 1. Sample expected coalescent tree for ten individuals drawn from a population of constant size. Lower terminals of tree correspond to individuals sampled at the present time; uppermost node of tree corresponds to a time 3.6Ne generations in the past.

Fig. 2. Minimum spanning network for control-region mtDNA sequences (1105 bp) for seven haplotypes obtained from a sample of ten individuals drawn from a population of Mexican Spotted Owls near Flagstaff, Arizona. Haplotype labelled ‘3’ was observed four times in the sample; each other haplotype occurred once. Network was rooted using sequences from other subspecies. Hatch marks indicate inferred DNA substitutions.
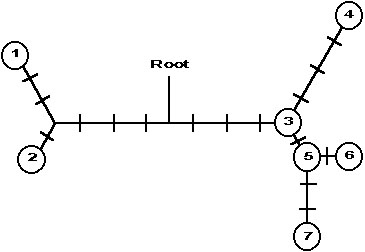
Fig. 3. Distribution of pairwise substitutions among ten individual sequences with relationships shown in Fig. 2 (heavy line). Expected distribution for a sample of ten individuals drawn from an exponentially growing population with mean identical to that of the observed distribution (thin line).
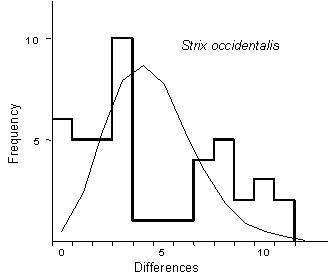
Fig. 4. Coalescent tree corresponding to minimum length network shown in Fig. 2. Hatch marks indicate inferred position of substitutions. Letters refer to inferred coalescent events and numbers at base correspond to haplotypes in Fig. 2. Note that haplotype ‘3’ occurred four times.
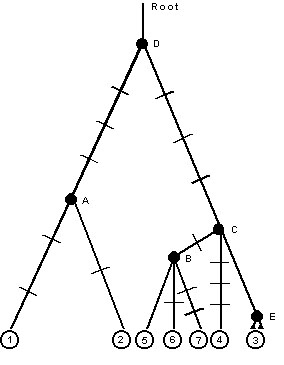
Fig. 5. Logarithm of number of segregating lineages for tree shown in Fig. 4. versus coalescent times for nodes. Dots indicate observed substitutions; circles indicate expected coalescent times for a stationary population; observed and expected values scaled so 3.6m Ne equals 4.2 substitutions.
