S32.3: Population divergence in Chaffinches Fringilla coelebs assessed with control-region sequences
Allan J. Baker1 & H. Dawn Marshall2
1Centre for Biodiversity and Conservation Biology, Royal Ontario Museum, 100 Queen's Park, Toronto, M5S 2C6 Canada, fax 416 586 5553, e-mail allanb@rom.on.ca; 2Department of Zoology, University of Toronto, 25 Harbord Street, Toronto, M5S 3G5 Canada,
Baker, A.J. & Marshall, H.D. 1999. Population divergence in Chaffinches Fringilla coelebs assessed with control-region sequences. In: Adams, N.J. & Slotow, R.H. (eds) Proc. 22 Int. Ornithol. Congr., Durban: 1899-1913. Johannesburg: BirdLife South Africa.Within the last million years, Chaffinches Fringilla coelebs are thought to have colonised the Atlantic islands (Azores, Madeira, and Canaries) from continental populations in Europe and north Africa. To assess the phylogeographic structure that has developed in the islands since that time, we sequenced 593 bp of the 3' end of the mitochondrial control region in each of 66 individuals representing eight populations from the three archipelagoes. Tajima's (1989) D test and Fu & Li's (1993) coalescent tests indicated that the sequences are selectively neutral or nearly so. Haplotypic diversities are reduced in three of the four Canaries populations, consistent with smaller population sizes there relative to the Azores. Populations in different archipelagoes contain separate suites of divergent haplotypes, indicating that strong population structure has developed among archipelagoes, and among islands within the Canaries, over a timespan of approximately 440000 years. Coalescent simulations indicate that gene flow among archipelagoes and between islands in the Canaries is effectively zero, and is asymmetric. Combined with previous analyses of variation in allozymes, skeletal morphometrics, and songs, a pattern of island evolution involving gradual divergence in small to moderate-sized populations is supported. Our studies confirm the major tenets of Grant's (1979) model of evolution of island populations of Chaffinches in that enhanced differentiation in the Canaries results from smaller population sizes, reduced gene flow and increased genetic drift there relative to the Azores, but founder effects have apparently not played an important role..
INTRODUCTION
Colonisations of remote oceanic islands provide excellent opportunities to study the processes of microevolution, particularly when peripherally isolated populations demonstrate marked divergence relative to their ancestral counterparts on neighbouring continents. A classic example of this is afforded by the Chaffinch Fringilla coelebs, a widespread Palearctic passerine species. Chaffinches are thought to have colonised the Atlantic islands (Azores, Madeira, and Canaries, Fig. 1) within the last million years from ancestral populations in North Africa and/or Europe (Grant 1979). Island populations are characterised by blue dorsal plumage and reddish-orange breasts, similar to neighbouring north African populations. Plumage variation is pronounced enough to warrant designation of different subspecies in the Azores F. c. moreletti and Madeira F. c. maderensis, and in the Canaries at least two subspecies are recognised (F. c. canariensis on the middle islands of Gran Canaria, Tenerife, and Gomera, and F. c. palmae on the western islands of La Palma and Hierro). Two subspecies occur in north Africa (F. c. africana in Morocco and F. c. spodiogenys in Tunisia). Continental European birds, which are quite distinct phenotypically from their north African conspecifics, are classified in a separate subspecies F. c. coelebs. Additionally, the congeneric Blue Chaffinch F. teydea inhabits the pine forests of Tenerife and Gran Canaria. This distinctive wholly blue species is likely the product of an earlier invasion of the Canaries by stock ancestral to the Chaffinch (Stresemann 1927 to 1934).
In a major statistical analysis of external measurements taken from museum skins, Grant (1979) demonstrated that island Chaffinches had evolved shorter wings but longer legs and bills and larger bodies than their continental conspecifics. Furthermore, beak depth and width had increased on the Azores but not on the Canaries. Grant interpreted these results as evidence for convergent evolution of Chaffinches in separate island environments, and possibly character displacement in Canary island populations where Blue Chaffinches and Chaffinches occur sympatrically. Within the Atlantic islands, populations of Chaffinches had differentiated more on the Canaries than on the Azores, and manifested less within-population variability, despite the larger average geographic distances between islands in the latter archipelago. This pattern was explained by a model invoking stronger directional selection coupled with random genetic drift, reduced gene flow and founder effects in the Canaries archipelago.
Grant's model of island evolution stimulated investigations of differentiation in allozymes (Baker et al. 1990) and skeletal morphometrics (Dennison & Baker 1991) in Chaffinches, which ultimately supported only some of the tenets of the model. The genetic analysis revealed that Atlantic island populations were strongly differentiated and had diverged considerably from their continental conspecifics. Additionally, reduced variability within and increased differentiation among Canary island populations relative to Azores and continental populations were reported. Because the pattern was consistent among loci, however, selection was not held responsible for genetic divergence of the Atlantic island populations. Instead, the observed genetic patterns were attributed to gradual divergence in small to moderate-sized isolated populations undergoing different levels of drift and gene flow. Morphometric variances were again lower in the Canaries but to a lesser extent than previously reported, and significantly lower only in one Canary island population (Hierro) and in Madeira. Phenotypic variance scaled with effective population size (estimated from the allozyme data) in the Azores relative to the Canaries, and thus morphometric patterns of population divergence were considered to be consistent with a neutral model of phenotypic evolution.
In a previous study (Marshall & Baker, in press) we used partial sequences from several mitochondrial genes to deduce Colonisation routes from a phylogenetic tree relating common haplotypes, and concluded that the most likely scenario was a sequential wave of Chaffinches from Iberia that moved through the Azores to Madeira and the Canaries. This hypothesis suggests that common ancestry rather than convergent evolution is responsible for shared island characteristics. Furthermore, character displacement mediated through competition with the Blue Chaffinch need not be invoked to explain small bill proportions of Chaffinches in the Canaries because they most probably acquired them in Madeira (where Blue Chaffinches are absent) before colonising the Canaries. Here we analyse much larger samples of one of these genes (the control region) to sketch further the broad outline of intraspecific phylogeography in Atlantic island Chaffinches. Our analysis contrasts results from traditional equilibrium models of population structure with newly developed methods based on coalescent theory which apply in non-equilibrium conditions and additionally incorporate information on the phylogeny of alleles. This way of deciphering microevolutionary processes such as migration and random genetic drift from genetic data adds a historical perspective to the models and concepts of population genetics, which have relied typically only on frequencies of alleles.
MATERIALS AND METHODS
Samples and laboratory methods
Tissue samples were obtained from five to ten individuals from eight Atlantic island populations of Chaffinches (Fig. 1 and Table 1; 66 individuals in total). Samples were collected from breeding adults over a ten year period. We chose three Azores populations to represent F. c. moreletti, and one (Hierro) to represent F. c. palmae of the Canaries. All three populations of F. c. canariensis were included, and one sample was obtained from the island of Madeira (F. c. maderensis).
Genomic DNA was extracted from liver, heart, or spleen using standard proteinase K-phenol-chloroform methods (Sambrook et al. 1989). Briefly, tissues were homogenised in 100 mM Tris-HCl pH 8.0, 10 mM EDTA, 100 mM NaCl, 0.1% SDS, and 10 m g mL-1 proteinase K, and incubated overnight at 55oC. The homogenate was extracted twice with Tris-saturated phenol and once with chloroform: isoamyl alcohol (24:1). Finally, nucleic acids were precipitated with sodium chloride or sodium acetate and ethanol, and resuspended in distilled water. DNA was prepared for sequencing using the polymerase chain reaction (Saiki et al. 1988). Double-stranded amplification reactions contained 10 mM Tris-HCl pH 8.3, 1.5 mM MgCl2, 50 mM KCl, 50 m M each dNTP, 0.4 m M each primer, and 1 U Taq DNA polymerase (Boehringer Mannheim) in a 25 m L volume. Amplification was achieved with a thermal cycle of 93oC for 30 sec, 48 to 50 oC for 30 sec, and 72 oC for 60 sec, repeated 35 times. Products were purified using agarose separation followed by binding to glass beads (Gene Clean; BIO 101), and were sequenced using either the Sequenase 2.0 (United States Biochemical) or AmpliCycle (Perkin Elmer) sequencing kit. We chose primers to target an approximately 600 bp portion at the 3' end of the control region as described previously (Baker & Marshall 1997); amplifications were performed with GSLGLU and H1261, and sequences were obtained with GSLGLU, F304, and H1261. The 3' end of the control region was chosen because it was found to be more variable among taxa than the 5' end, and because high rate variation among sites makes the 5' end problematic at higher divergences (Marshall & Baker 1997).
Data Analyses
Departures from neutral expectations were assessed using Tajima's (1989) test, a method which compares two different estimates of q (2Nm ), the number of segregating sites in a sample of sequences (S) and the average pairwise number of differences (k). Because these estimators have different sensitivities to factors such as population subdivision and bottlenecks, as well as to background selection and selective sweeps, the test statistic also provides a useful indication of historical demographic processes. We chose to use Tajima's test because simulations have shown that it is generally more powerful in detecting evidence for these alternative hypotheses than the Ewens-Watterson test of homozygosity (Charlesworth et al. 1995; Simonsen et al. 1995). The average number of pairwise differences (k), the number of segregating sites corrected for sample size (S/a where S is the number of segregating sites and a = S 1/i for i = 1 to n where n is the sample size), and Tajima's test statistic (D) were calculated for each population separately, as well as for the three Azores populations combined. Because substantial subdivision was evident among the Canaries populations, we did not pool individuals from these populations. Test statistic values were compared against the beta distributions provided in the original paper, and against the simulated distributions presented by Simonsen et al. (1995). We also present Fu & Li's (1993) F* statistic as it is the coalescent analogue of the equilibrium Tajima's D value.
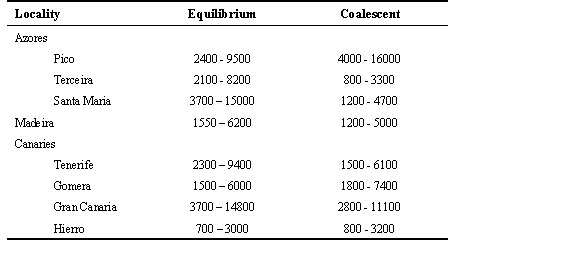
Classical estimates of gene flow (Nm, where N is the effective population size and m is the rate of migration among populations) were computed from pairwise FST values, and these values served as input for maximum likelihood estimation of Nm allowing for possible asymmetries in gene flow among populations using the computer programme Migrate (Beerli 1997). Long-term effective population sizes for the island populations were estimated from the average pairwise distance among individuals in the population (d) using the relationship described by Wilson et al. (1985): Ne = 106tX/sg, where tX is 0.5d, s is the evolutionary rate, and g the generation time. We used Kimura two-parameter (Kimura 1980) distances, an evolutionary rate of 3.93% per million years per lineage (corrected for within species polymorphism), and a generation time of two years. The evolutionary rate was derived from the average sequence divergence for this portion of the control region between all Chaffinch haplotypes and the closely related Blue Chaffinch (Marshall & Baker 1997) which are thought to have diverged approximately one million years ago (Grant 1979). Estimation of Ne using the coalescent was made from the quantity q = 2 Nem , where m is the mutation rate for the 3' control-region sequences (1 x 10⁻⁷ to 4 x 10⁻⁷ substitutions/site/myr). Unlike the equilibrium approach, values of q for each population can vary because Ne is not assumed to be equal.
Mismatch distributions of the frequencies of pairwise differences among individuals in the population (d) were compared for island populations. The pattern and smoothness of the histogram indicates whether population size has been stationary for a long time, or has undergone expansion in the past (Rogers & Harpending 1992). We used the average pairwise number of differences among all individuals calculated with the computer programme DnaSP (Rozas & Rozas 1997) and compared them graphically with the expected values under no population growth or population expansion separately for the Azores and for the Canaries populations. Coalescent estimates of population growth were obtained using the computer programme Fluctuate (Kuhner & Yamato 1998).
Time to the most recent common ancestor (TMRCA) of the island haplotypes was estimated using the standard molecular clock approach based on average genetic distance between the Canaries and Azores haplotypes, and also using the coalescent approach incorporating asymmetric gene flow, population growth and variable population sizes. Calculations of TMRCA and the age of each of the mutations in the haplotypes were modelled using 100,000 simulations in the computer programme Genetree (Griffiths 1998). A starting value for the mutation parameter q was set at 1.0 as this corresponds to our estimate of 10-7 substitutions/site/myr for the 3' end of the control region in Chaffinches. As the programme requires a binary incidence matrix in which no parallel or back mutations are allowed, six of the 46 sites were eliminated. Haplotype 10 in the Madeira sample was removed because it is thought to represent an ancient migration event from the Canaries.
RESULTS
Sequences and haplotypes
A total of 593 bp of control region sequence was obtained for 66 individuals from 8 populations of Chaffinches, corresponding to positions 617 to 1222 of the control region sequence presented in Marshall & Baker (1997). The aligned sequences contain 46 variable positions that define 19 haplotypes (Table 2). The average transition to transversion ratio among haplotypes is 2.75. Island haplotypes differ from each other by 1 to 22 differences; Azores haplotypes have 1 to 4 differences and Canaries haplotypes have 1 to 14 differences. Haplotype and nucleotide diversity are approximately equal in Azores and Canaries populations, with the exception that the population from Hierro has a strikingly reduced level of genetic diversity (Table 3). The elevated diversity in the Madeira population is an artifact of the inclusion of the migrant ‘Canaries’ haplotype 10 in the sample; if this haplotype is excluded then haplotype and nucleotide diversity are similar to values in other archipelagoes.
Neutrality of sequences
None of the populations had Tajima's (1989) D values significantly different from zero (Table 4), although the D value for Gomera is significantly positive at the 0.05 level using the Simonsen et al. (1995) confidence limits. Although not significant, the D values for Madeira, Gran Canaria, and Hierro are quite negative, whereas the D values for all three Azores populations and Tenerife are much closer to zero. The pooled Azores individuals also did not have D values significantly different from zero, despite the elevated sample size. Coalescent estimates using Fu & Li's (1993) F* statistic are also not significantly different from neutral expectations.
Gene flow The pairwise FST values among all populations indicate that extensive gene flow occurs in the Azores archipelago but not in the Canaries or among all three archipelagoes (Table 5). Corresponding estimates of Nm(f) are also low (< 4) for all comparisons using the more conventional equilibrium NST statistic of Lynch & Crease (1990). Coalescent estimates of Nm emphasise these results, and indicate that gene flow among Canaries populations and among Pico and other Azores populations are effectively zero, and that gene flow is better modelled as an asymmetric process (Table 5). Population size, growth and TMRCA Estimates of q calculated under equilibrium and coalescent models tend to be higher for the former, though the differences are not large (Table 6). These values translate into long term effective population sizes that range between 0.7 x 10³ to 1.6 x 10³. Similar effective population sizes occur in the Azores and the Canaries, with only the Hierro population having a noticeably smaller Ne (Table 7). The pairwise distributions are difficult to interpret because the observed and expected distributions under no growth or population expansion fit almost equally well (Fig. 2). However, coalescent simulations using Migrate indicate clearly that the Azores population is experiencing moderate growth (g = 2656 ± 179) whereas the Canaries population is stable or declining (g = -50 ± 59).Using the above estimates of migration and growth rates, and a starting q of 1.0 (assuming an island Ne of 104 and a per sequence mutation rate of 10-4), the Monte Carlo Markov chain procedure implemented in Genetree estimates the age of the most recent common ancestor of the island birds to be 22Ne coalescent time units, which equals 22Ne x generation time. Using Ne = 104 and a generation time of two years yields a time of 440,000 years. This is somewhat longer than the estimate of 370,000 years using a standard molecular clock calibrated to a hypothesised time of divergence of the Blue Chaffinch from the Chaffinch of one million years.
DISCUSSION
Neutrality of control-region sequences
Both classical and coalescent tests of the neutrality of the control region sequences in island Chaffinches suggest they are either neutral or nearly neutral. The latter is consistent with the negative values of Tajima's D, because the test statistic evaluates the difference between number of pairwise differences (k) and number of segregating sites (S/a), and the latter is expected to be more highly affected by the presence of excess low frequency mutations (Tajima 1989). Although none of the Canaries populations exhibited significantly negative D estimates there was a definite trend for the D values in the smaller Canaries populations to be highly negative, whereas no such trend was observed among Azores populations, a pattern which appears to support the nearly neutral expectation. Although negative D estimates are also expected following selective sweeps (Simonsen et al. 1995), Charlesworth et al. (1995) demonstrated that significant Tajima's tests are difficult to obtain from loci in regions of the genome where recombination is low, and suggest that this is more consistent with the operation of background selection (the reduction in genetic diversity caused by selection against low-frequency deleterious alleles) than with selective sweeps.
Evolution of Chaffinches on the Atlantic islands
The estimates of gene flow produced by both classical and coalescent methods provide strong evidence of genetic structuring among Atlantic island archipelagoes, among subspecies within the Canaries, and even among different island populations of F. c. canariensis. Estimates of the number of female migrants per generation are highest among Azores populations, suggesting that female-mediated gene flow (Nm > 4) is likely sufficient to prevent differentiation in mtDNA by drift alone. This supports estimates from biparentally transmitted allozymes (Nm = 5.1 to 10.2) which suggest that gene flow has been high enough to prevent population differentiation of nuclear DNA encoded characters in the Azores (Baker et al. 1990). Despite the smaller geographic distances between islands in the Canaries, gene flow between them appears to be very restricted, possibly reflecting their small census population sizes. The coalescent modelling of gene flow revealed that the migration of females is highly asymmetric, a conclusion we could not have drawn from classical techniques.
Long-term effective population sizes appear somewhat reduced in several Canaries populations and Madeira according to estimates of diversity and Tajima's tests, but are significantly reduced only in Hierro. The estimates of Ne in the Azores and Canaries are not as different as might be expected from the approximately tenfold difference between their current census population sizes (Baker et al., 1990). This is consistent with the coalescent simulations which indicate the Azores population has been growing slowly whereas the Canaries populations are stable or declining.
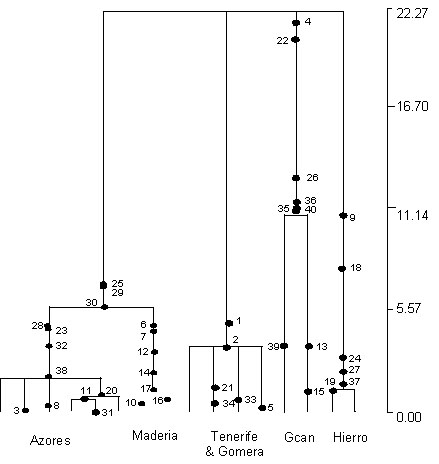
The value of the coalescent is clearly revealed in the Genetree simulations where much more realistic demographic parameters can be incorporated in the model. Additionally, the estimation of the age of mutations on the tree indicates that most of the older mutations have occurred on the branches leading to the Canaries haplotypes, and that the Azores mutations are all quite recent. This in turn suggests that the Canaries were colonised long before the Azores or Madeira, but the lack of resolution at the base of the gene tree does not permit us to reconstruct colonisation routes or continental source populations. Given the relative recency of the evolution of phylogeographic structure in island Chaffinch populations (which we now know to be within the last 500,000 years), it is perhaps not surprising that conclusive evidence of their Colonisation remains elusive. Faster evolving markers such as microsatellites are required to help solve this trichotomy (Fig. 3).
Grant's model of island evolution
To explain the greater amount of morphometric differentiation among the Canaries populations of Chaffinches relative to the Azores, Grant (1979) posited stronger directional selection, enhanced genetic drift, reduced gene flow and founder effects in the smaller Canaries populations. This hypothesis has now been tested with analyses of variation in allozymes (Baker et al. 1990), skeletal morphometrics (Dennison & Baker 1991), songs (Lynch & Baker 1994), and mtDNA control region sequences (this study). Results of all these studies support the major tenets of Grant’s model, with the exception that there is no available evidence to support directional selection as a prime agent in promoting divergence of populations within and among island archipelagoes. This is perhaps not surprising since the control region, allozyme and song data appear to be effectively neutral or nearly so. Grant’s model is very possibly correct in all aspects except that founder effects have been of very minor importance, as severe reductions in population size are restricted to one population in the Canaries (Hierro). Gradual divergence in small to moderate-sized populations as postulated under the neo-Darwinian model (Barton & Charlesworth 1984) is a much more plausible explanation for the evolution of island populations.
ACKNOWLEDGMENTS
We thank Oliver P. Haddrath and Carol E. Ritland for laboratory assistance, Mark K. Peck for sample collection and laboratory assistance, Alejandro M. Lynch and Michael D. Dennison for helpful discussion and sample collection, and Alejandro M. Lynch for assistance with data analysis. Funding was provided by NSERC grant A200 to AJB, an NSERC post-graduate scholarship to HDM, and a Frank M. Chapman grant to HDM for field work.
REFERENCES
Baker A.J., Lynch, A.M., Dennison, M.D., & Le Grand, G. 1990. Genetic divergence in peripherally isolated populations of chaffinches (Fringilla coelebs) in the Atlantic islands. Evolution 44: 981-999.
Baker, A.J., & Marshall, H.D. 1997. Mitochondrial control region sequences as tools for understanding evolution. In: Mindell D. (ed) Avian molecular evolution and systematics; San Diego; Academic Press: 51-82.
Barton, N.H., & Charlesworth, B. 1984. Genetic revolutions, founder effects and speciation. Annual Review of Ecology & Systematics 15: 133-164.
Beerli, P. 1997. MIGRATE: documentation and program, part of LAMARC. http://evolution.genetics.washington.edu/lamarc.html.
Charlesworth, D., Charlesworth, B., & Morgan, M.T. 1995. The pattern of neutral molecular variation under the background selection model. Genetics 141: 1619-1632.
Dennison, M.D., & Baker, A.J. 1991. Morphometric variability in continental and Atlantic island populations of chaffinches (Fringilla coelebs). Evolution 45: 29-39.
Fu, Y.-X., & Li, W.-H. 1993. Statistical tests of neutrality of mutations. Genetics 133: 693-709.
Grant, P.R. 1979. Evolution of the chaffinch, Fringilla coelebs, on the Atlantic Islands. Biological Journal of the Linnaean Society 11: 301-332.
Griffiths, R.C. 1998. R.C. Genetree: documentation and program distributed over the Internet, http://www.maths.monash.edu.au/~mbahlo/mpg/gtree.html.
Kimura, M. 1980. A simple method for estimating evolutionary rate of base substitutions through comparative studies of nucleotide sequences. Journal of Molecular Evolution 16: 111-120.
Kuhner, M. & Yamato, J. 1998. FLUCTUATE: documentation and program, part of LAMARC. http://evolution.genetics.washington.edu/lamarc.html.
Lynch, A. & Baker, A.J. 1994. A population memetics approach to cultural evolution in chaffinch song: differentiation among populations. Evolution 48: 351-359.
Lynch, M., & Crease, T.J. 1990. The analysis of population survey data on DNA sequence variation. Molecular Biology and Evolution 7: 377-394.
Marshall, H.D., & Baker, A.J. 1998. Colonisation history of Atlantic island common chaffinches (Fringilla coelebs) revealed by mitochondrial DNA. Molecular Phylogenetics and Evolution (in press).
Marshall, H.D., & Baker, A.J. 1997. Structural conservation and variation in the mitochondrial control region of fringilline finches (Fringilla spp.) and the greenfinch (Carduelis chloris). Molecular Biology and Evolution 14: 173-184.
Rogers, A.R., & Harpending, H. 1992. Population growth makes waves in the distribution of pairwise genetic differences. Molecular Biology and Evolution 9: 552-569.
Rozas, J. & Rozas, R. 1997. DnaSP version 2.0: a novel software package for extensive molecular population analyses. Computational Applications in Biosciences 13: 307-311.
Saiki, R.K., Gelflan, D.H., Stoffel, S., Scharf, S.J., Higuchi, R., Horn, G.T., Mullis, K.B., & Erlich, H.A. 1988. Primer-directed enzymatic amplification of DNA with a thermostable DNA polymerase. Science 239: 487-491.
Sambrook J., Fritsch, E.F., & Maniatis, T. 1989. Molecular cloning: a laboratory manual, 2nd edition. New York; Cold Spring Harbor Laboratory Press.
Simonsen, K.L., Churchill, G.A., & Aquadro, C.F. 1995. Properties of statistical tests of neutrality for DNA polymorphism data. Genetics 141: 413-429.
Stresemann, E. 1927-1934. Aves. In: Kukenthal, G. (ed) Handbuch der zoologie VII; Berlin; Walter de Gruyter & Co.: 729-853.
Tajima, F. 1989. Statistical method for testing the neutral mutation hypothesis by DNA polymorphism. Genetics 123: 585-595.
Wilson, A.C., Cann, R.L., Carr, S.M., George, M., Gyllensten, U., Helm-Bychowski, K.M., Higuchi, R.G., Palumbi, S.R., Prager, E.M., Sage, R.D., & Stoneking, M. 1985. Mitochondrial DNA and two perspectives on evolutionary genetics. Biological Journal of the Linnaean Society 26: 375-400.
Table 1. Samples of Chaffinches analysed for this study.

Table 2. Variable sites defining control region haplotypes.
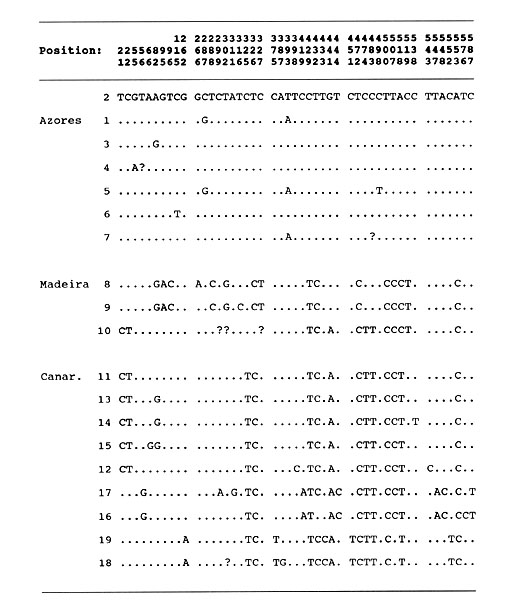
Table 3. Control region sequence diversity.
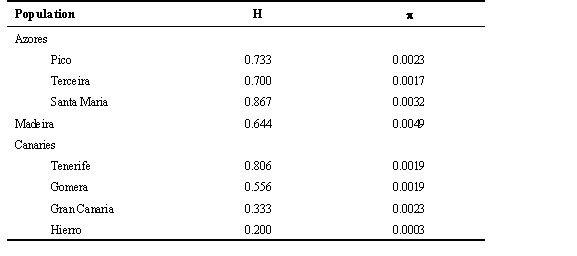
Table 4. Results of Tajima's (1989) and Fu & Li's (1993) tests of departure from neutrality.
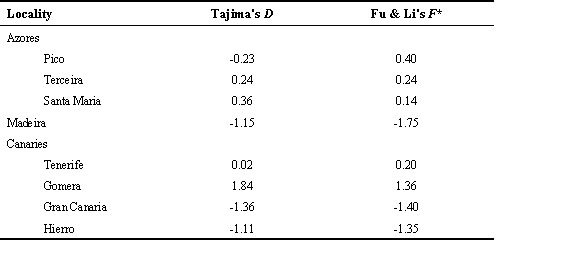
Table 5. Estimates of gene flow among Atlantic island populations.
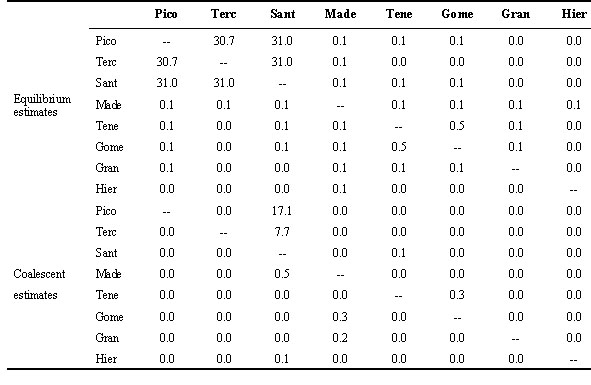
Table 6. Theta estimates.
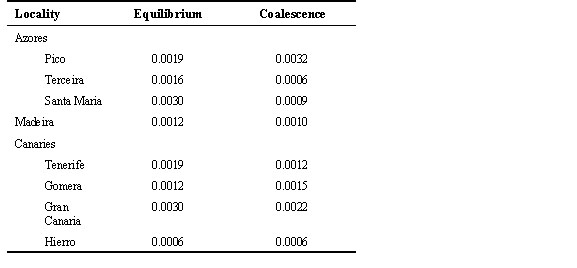
Table 7. Estimates of effective population size.
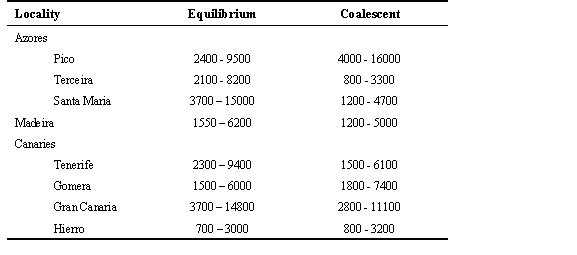
Fig. 1. Map showing localities where Chaffinches were sampled for this study.
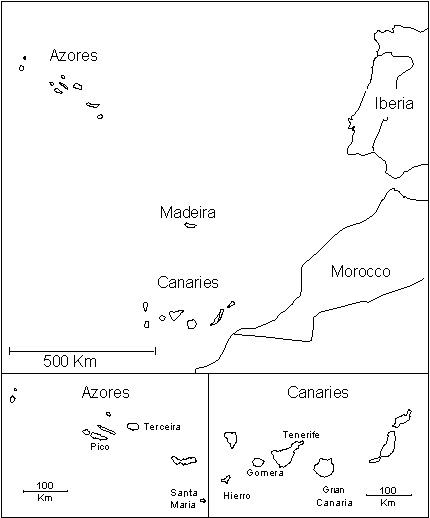
Fig. 2. Mismatch distribution of pairwise differences among haplotypes for the Azores (A) assuming constant population size, and (B) assuming population growth.
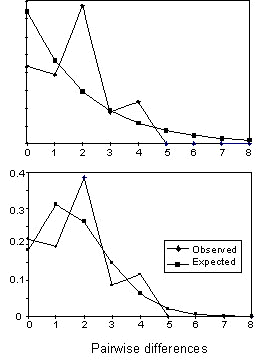
Fig. 3. Maximum likelihood tree, based on the coalescent process, indicating the location of mutations along the branches. The scale is in gene population size units.
