S31.4: Flight behaviour of migrating raptors under varying environmental conditions
Reto Spaar
Swiss Ornithological Institute, CH-6204 Sempach, Switzerland, fax 41 41 462 9710, e-mail spaarr@orninst.ch
Spaar R. 1999. Flight behaviour of migrating raptors under varying environmental conditions. In: Adams, N.J. & Slotow, R.H. (eds) Proc. 22 Int. Ornithol. Congr., Durban: 1844-1862. Johannesburg: BirdLife South Africa.Vertical and horizontal air movements are two major environmental factors affecting flight behaviour. How do migratory raptors react to these factors? Tracking radar provided exact data on flight parameters of migrating raptors in southern Israel. In soaring-gliding flight, many species maximised cross-country speeds by adopting thermal dependent gliding airspeeds; those agreed with predictions of aerodynamic theory. Inter-thermal gliding airspeeds decreased with increasing tailwind-components and allowed the birds to reduce time-consuming thermal circling by prolonging the range of inter-thermal glides. Flight altitudes of larger soaring species, such as Aquila, Buteo and Pernis, reflected the diurnal variation of convective activity. They depended to a high extent on vertical air lifts. Besides circling in thermals, straight line soaring was frequently observed in large species. Smaller species, such as Circus, Accipiter or Falco, additionally used flapping-gliding flight, mainly after sunrise and before sunset when thermal convection was weak or absent, and more frequently in headwinds than in tailwinds. Nocturnal migration of Levant Sparrowhawks Accipiter brevipes and harriers is discussed. It is still an open question whether raptor migration is time- or energy-selected. Soaring-gliding flight was the predominant flight style in all species analysed. Time-minimizing migration seems to be important in smaller raptor species extending daily flight activity by flapping flight. Besides flight strategy, investigations on stopover and feeding behaviour before and during the migratory journey are needed for a comprehensive understanding of energy in- and output.
INTRODUCTION
Time, energy and safety are three optimisation criteria in migratory birds (Alerstam & Lindström 1990; Alerstam 1991). Their energy budget involves energy accumulation at stopover sites, energy expenditure during migratory flight and resting costs (for example during the night in diurnal migrants). The total duration of migration depends on fat accumulation rate influencing the time spent at stopover sites and on flight speeds. Hedenström (1997) analysed migration speeds of Lesser Spotted Eagles Aquila pomarina and discussed the relative importance of fuel accumulation rate, climbing rate in thermals, limitations on thermal time and energy cost of gliding flight. The flight strategy is only one factor affecting the overall cross-country performance. Energy expenditure in flight depends on flight style: It is generally agreed that energy expenditure in flapping flight increases substantially with body mass (power at maximum range speed is proportional to (body mass)7/6; Pennycuick 1972), whereas costs for gliding flight are estimated as 2-4 times basal metabolic rate (BMR) (Lasiewski & Dawson 1967; Baudinette & Schmidt-Nielsen 1974; Lustick et al. 1978; Ellis 1984).
Along their route between breeding area and winter quarter, migrants have to cope with different environmental conditions. For nocturnal migrants, the most important weather factor is the actual wind situation: In central Europe, the variation in migratory density from night to night is highly correlated with the corresponding tailwind support, whereas other meteorological factors such as ambient temperature or relative humidity have little impact (Baumgartner 1997). Within a night, the migrants choose flight altitudes with best tailwind support (Bruderer et al. 1995b). Beside the horizontal winds, vertical air movements strongly affect the flight strategy of diurnal migrants.
Two main flight styles are observed in raptors which usually move during the day: soaring-gliding and flapping-gliding. In soaring-gliding flight, the strength of thermal convection and the gliding performance limit the achievable cross-country speed (Pennycuick 1972, 1975, 1989). According to aerodynamic theory, birds maximising cross-country performance in soaring-gliding flight should not adopt constant inter-thermal gliding airspeeds, but should vary it according to the actual climbing rate in thermal circling (Pennycuick 1989). Except for the variable wing-area and wing-span in birds, this is very similar to the theory of McGready for glider pilots when optimising cross-country performance (Reichmann 1979). However, glider pilots usually fly slower than the theoretical predicted airspeed between thermals, but often achieve faster cross-country speeds than predicted: lower sinking rates in gliding allow a reduction of time-consuming thermal circling which leads to enhanced cross-country speeds (Pennycuick 1998). Steppe Buzzards Buteo buteo vulpinus adopt thermal dependent airspeeds according to the aerodynamic theory and, therefore, maximise cross-country performance (Spaar & Bruderer 1997b). Flight altitudes of diurnal raptor migrants depended on thermal convection. In general, they increased with increasing climbing rate in thermal circling (Spaar 1995, Spaar and Bruderer 1996). In a soaring-gliding strategy, flight altitude above ground is a potential energy which allows a bird to cover a certain distance by gliding. Flight altitude in soaring-gliding flight is limited by the upper boundary of thermal convection: it is built up after sunrise when sun radiation warms up the surface, rises throughout the morning and reaches its maximum in the early afternoon (Kerlinger 1989). The strength of thermal convection and the upper boundary of the convective field are determined by the atmospheric structure; forecasting of convective activity is possible by applying a numerical convection model based on radio sounding measurements of temperature, air pressure and humidity (Liechti & Neininger 1994). I compare the flight altitudes and climbing rates with the prediction of this program. The aim of this comparison is to determine whether migrating raptors use the whole range of the potential convective field, and whether climbing rates in thermal circling reflect meteorological conditions.
Beside soaring-gliding flight, smaller raptors such as harriers, falcons or sparrowhawks also migrate in flapping-gliding flight (Spaar 1997; Spaar & Bruderer 1997a). This allows the birds to migrate even when thermal convection is absent. But when should birds use flapping-gliding instead of soaring-gliding flight? Are these birds time- or energy minimising during migration? The present paper summarises the results of a four year study on the flight strategies of migrating raptors in southern Israel (Spaar 1996), and it discusses the influence of environmental factors affecting flight behaviour.
METHODS
We studied raptor migration during three migratory periods in southern Israel at two observation sites, in the Negev Highlands and in the Arava Valley (Liechti & Bruderer 1995). Observations took place from 10 September to 31 October 1991 at both sites, from 1 March to 20 May 1992 and from 10 August to 18 September 1992 in the Arava Valley, and from 1 to 30 April 1992 in the Negev Highlands. In autumn 1991, observations lasted from 1600 throughout the night until 1100 the following day (Greenwich +2h), whereas in spring and autumn 1992 they covered the whole 24 hours.
Migration was studied by a tracking radar ‘Superfledermaus’. It allows tracking of a single, medium sized raptor up to a distance of about 8 km. Each second, the radar transmitted the exact position of the bird (distance ± 10 m; azimuth and elevation ± 0.06° ; Bruderer et al. 1995a) to a computer and the track was simultaneously visualized on the computer screen. An experienced birdwatcher identified the target through a 12.4x telescope mounted parallel to the radar beam. The visual observation of each bird during the time it was tracked provided information on gliding and flapping behaviour.
Every four hours, pilot balloons were released and provided data on wind speed and direction at all flight levels up to 4000 m above ground level (a.g.l.). To measure the cross-country speed relative to the ground, a horizontal line was drawn on the flight path so that the distance between the start- and the endpoint was at least 2 km; this distance was divided by the time taken to cover it. Gliding direction was considered to be the preferred migratory direction. Airspeeds (gliding airspeed and cross-country speed relative to the air) were calculated by subtracting the wind vector from the groundspeed vector.
To analyse the tracks, these were subdivided into 10-second intervals and the flight phases, with respect to soaring, gliding and flapping, marked interactively on the computer screen. Averages of the flight parameters were calculated for each flight phase. Complete gliding and soaring phases were marked interactively at the computer screen. A complete circling phase in a thermal lasted from the end of a gliding phase to the start of the next gliding when the bird was circling in a thermal; a complete gliding phase accordingly from the end of a circling phase to the start of the next. Soaring in straight line (i.e. linear soaring according to Pennycuick 1998) was assumed if the bird had positive vertical speeds in straightforward gliding for at least 40 seconds. Statistics are based on Sokal and Rohlf (1981), circular statistics on Batschelet (1981).
Phenology of flight altitudes and climbing rates in thermal circling were compared with a new approach to the climatology of thermal soaring: based on radiosoundings at the observation sites, the numerical convection model «alptherm» makes predictions on the factors mentioned above; in Switzerland and Germany this model is in use to forecast thermal conditions for glider pilots (Liechti & Neininger 1994; Liechti & Lorenzen 1998). Parameters were adopted to the specific situation of the Arava Valley.
The following raptor species wintering in Africa were observed by radar in southern Israel: Griffon Vulture Gyps fulvus, Egyptian Vulture Neophron percnopterus, Short-toed Eagle Circaetus gallicus, Steppe Eagle Aquila nipalensis, Lesser Spotted Eagle, Booted Eagle Hieraaetus pennatus, Steppe Buzzard, Honey Buzzard Pernis apivorus, Black Kite Milvus migrans, Marsh Harrier Circus aeruginosus, Montagu's Harrier Circus pygargus, Pallid Harrier Circus macrourus, European Sparrowhawk Accipiter nisus, Levant Sparrowhawk, Hobby Falco subbuteo, Kestrel Falco tinnunculus, Lesser Kestrel Falco naumanni and Red-footed Falcon Falco vespertinus.
RESULTS Some of the tracked Griffon Vultures, Egyptian Vultures and Short-toed Eagles were resident birds.Flight altitudes
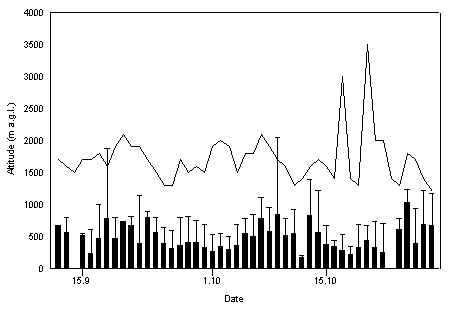
In Israel, there was a considerable daily variation in the vertical extension of the convective field. In the Arava Valley in autumn 1991, its upper boundary limit was between 1300-3500 m above ground level (a.g.l.), on most days it varied between 1500-2000 m a.g.l. (Fig. 1). The median and 90%-limit of flight levels of raptor migration and predicted upper boundary limit were not correlated (n = 45; median, r = -0.04, n.s.; 90%-limit, r = -0.07, n.s.). In autumn, observation lasted until 1100 in the morning and from 1600 onwards (Greenwich +2h). Thus, recorded upper flight levels in autumn were rather low due to lacking observations during the middle of the day.
The median and 90%-limit of flight altitudes of Aquila, Buteo, Pernis and Circus species showed a typical increase during daytime (Fig. 2). If thermal convection was available these species predominately migrated by soaring-gliding flight. Maximum flight levels were at about 1600 m a.g.l. for Circus sp., at 1800 m a.g.l. for Aquila sp. and at 2400 m a.g.l. for Buteo and Pernis. In all groups, the 90%-limit of flight altitudes during daytime did not exceed 1400 m a.g.l., except for Buteo and Pernis in the early morning: two groups of Honey Buzzards (3 and 5 individuals), tracked at high altitude of 2030 m and 2130 m a.g.l., were soaring in lee-waves generated by the mountains of the Negev Highlands (see Bruderer et al. 1994). The 90%-limit of flight altitudes of Falco and Accipiter sp. is relatively high in the early morning because of birds migrating by flapping-gliding flight.
Soaring-gliding flight
Thermal soaring
Climbing rates in thermal circling varied with time of day; they were highest around noon and in the early afternoon (Fig. 3). Climbing rate (median 1.84 m s-¹, range 0.10-5.06 m s-¹) and height gain (median 155 m, range 5-1455 m) were positively related to the flight level where birds started circling (climbing rate, n = 715, r = 0.34, P < 0.001; height gain, r = 0.19, P < 0.001). Duration of thermal circling (median 90 s, range 10-540 s) showed a positive correlation with climbing rate (r = 0.16, P < 0.001), but was not related to flight level when birds started circling (r = 0.02, n.s.) or to wind speed (r = -0.02, n.s.). Species reacted differently to different climbing rates: Steppe Buzzards increased circling duration with increasing climbing rate (Spaar 1995), whereas Steppe Eagles only expanded circling duration up to a climbing rate of 2.5 m s-¹; if they reached higher climbing rates, they reduced soaring time and had a constant height gain of about 200-250 m in completed circling phases (Spaar & Bruderer 1996).
Straight line soaring
Straight line soaring (i.e. linear soaring according to Pennycuick 1998) is an additional strategy observed in many species in southern Israel. This flight style combines gain of altitude and progress in the direction of migration and, thus, considerably enhances cross-country speeds. Above more or less flat surfaces, it becomes possible in lee-waves or when thermal columns build a chain (thermal street) that allows birds to glide straight along these thermals and to gain height simultaneously. In this study, straight line soaring was assumed if the birds had positive vertical speeds for at least 40 seconds in normal gliding. It often occurred before or after circling in thermals. Mean duration of straight line soaring across species was 70 ± 50 seconds (mean ± S.D.; range 40-580 s, median 50 s, n = 291), mean vertical speed 1.19 ± 0.59 m s-¹ (range 0.04-3.66 m s-¹, median 1.12 m s-¹). In Israel, some birds covered considerable distances in linear soaring: In the Arava Valley on 17 May 1992 at 1723 (Greenwich +2h), a flock of eight Honey Buzzard covered a distance of 5970 m in linear soaring with an average positive vertical speed of 0.80 m s-¹ and a total height gain of 267 m. They flew at an average altitude of 1915 m a.g.l. in a strong tailwind of 10 m s-¹ indicating lee-wave situation; the birds air- and groundspeed were 11.94 m s-¹ and 17.55 m s-¹, respectively. In larger species, straight line soaring occurred in reasonable proportions compared to circling in thermals: Short-toed Eagle (straight line soaring 17%, circling in thermals 21%), Griffon Vulture (12%, 30%), Steppe Eagle (11%, 31%), Lesser Spotted Eagle (7%, 36%) and Booted Eagle (6%, 34%) (Spaar 1997).
Inter-thermal gliding
Mean distance in inter-thermal gliding was 1740 ± 1245 m (range 165-8265 m, n = 458; tracks of different species with completed thermal and inter-thermal gliding phase were taken into amount). Inter-thermal gliding distance was positively correlated with climbing rate in thermal circling (r = 0.34, P < 0.001), gliding airspeed (r = 0.30, P < 0.001) and flight altitude above ground when gliding started (r = 0.21, P < 0.001). In a multiple regression analysis, all three factors had a significant influence on gliding distance and explained 16.3% of its variation (method backward stepwise; F3,454 = 30.60, P < 0.0001; multiple r = 0.41, adjusted R2 = 0.163; airspeed, b = 0.19, t454 = 3.99, P < 0.001; climbing rate, b = 0.23, t454 = 4.88, P < 0.001; flight altitude, b = 0.15, t454 = 3.48, P < 0.001; intercept, n.s.).
Optimal soaring-gliding flight
In order to maximise cross-country performance, soaring-gliding birds have to adopt thermal dependent inter-thermal gliding airspeeds (Pennycuick 1989). Higher climbing rates should be transformed into higher gliding airspeeds. Lesser Spotted Eagles adopted thermal dependent airspeeds, but the regression line of observed data lies below the line of theoretical optimal airspeed Va(opt), mainly due to lower airspeeds for higher climbing rates than 3 m s-¹ (Fig. 4A). However, the regression line of cross-country speeds is in accordance with the line of predicted maximum cross-country speed Vcc(max) (Fig. 4B). Sinking rates in inter-thermal gliding were lower than predicted by the theoretical glide polar (Fig. 4C). There is a considerable scatter in the observed data. Deviations of gliding airspeed and sinking rate from regression lines (Figs 4B and Fig 4C) at least partially explained deviations of cross-country airspeed in Fig. 4A: Residuals of cross-country airspeed are positively correlated with residuals of gliding airspeed and negatively with sinking rate in inter-thermal gliding (Fig. 5). No correlation was found between residuals of gliding airspeed and sinking rate.
Steppe Buzzards and Levant Sparrowhawks adopted airspeeds within the range of optimal airspeed in Pennycuick’s model (Spaar & Bruderer 1997b; Spaar et al. 1998). Accordingly, these species maximise cross-country speeds in soaring-gliding flight. Marsh Harriers also adopted thermal dependent airspeeds, whereas the smaller Montagu’s/Pallid Harriers did not (Spaar & Bruderer 1997). Steppe Eagles increased gliding airspeed with increasing climbing rates in thermal circling, but less than the model’s prediction, probably because these birds often did not circle but soared in straight line under favourable thermal conditions (see also straight line soaring) (Spaar & Bruderer 1996).
Flapping-gliding flight
Raptors show a mixed flapping-gliding flight rather than pure flapping flight. However, flapping proportions are highly variable. In Israel, flapping proportions in horizontal flight (i.e. vertical speed ± 0.5 m s-¹) were between 48-77% in Marsh Harriers, 32-87% in Montagu’s/Pallid Harriers, and 29-100% in Levant Sparrowhawks (Spaar & Bruderer 1997a; Spaar et al. 1998). Mean airspeed of harriers was 8.0 m s-¹ in autumn (Spaar & Bruderer 1997a). Levant Sparrowhawks adopted mean airspeeds of 9.6 m s-¹ at night and 10.4 m s-¹ during daytime in autumn; in spring, diurnal migrants had a mean airspeed of 11.3 m s-¹ (Spaar et al. 1998).
Diurnal and nocturnal phenology
Stark and Liechti (1993) documented Levant Sparrowhawk migration at night, based on electronically identified wing beat patterns. A quantitative estimation shows that a considerable proportion of the Levant Sparrowhawk population may migrate at night (Spaar et al. 1998): out of the 22000-44000 birds crossing Israel every season (Leshem & Yom-Tov 1996a; these numbers are based on systematic counts during daytime), the estimated number migrating at night is 3000-5000 in autumn and 2000-3000 in spring; this is 5-10% of the migrating Levant Sparrowhawk population. Nocturnal migration occurred also in harriers, but the magnitude of nocturnal compared to diurnal migration in these species is unknown (Gatter 1984; Spaar & Bruderer 1997a).
Cross-country speeds
In soaring-gliding flight, mean cross-country airspeeds of the different migratory raptors species ranged from 7.50-10.17 m s-¹ (27.0-36.6 km h-¹), corresponding groundspeeds of 8.60-11.35 m s-¹ (31.0-40.9 km h-¹) (Spaar 1997). Including all flight styles, cross-country airspeeds of harriers did not differ between flight styles and seasons; cross-country groundspeeds were higher in autumn under following winds than in spring under opposing winds (Spaar & Bruderer 1997a). Migrating Levant Sparrowhawks in spring reached higher cross-country air- and groundspeeds in flapping-gliding than in soaring-gliding and in soaring-flapping flight (Spaar et al.1998).
Influence of wind
The wind regime in the southern part of Israel is dominated by the trade wind system, with north-northeasterly winds up to 1500-2000 m above sea level and southerly winds above. In spring, the trade wind system is often disturbed by westerly fronts. Since more than 90% of soaring birds fly below 1400 m a.g.l., they fly under primarily head- and sidewinds in spring and tailwinds in autumn.
Flight directions
Gliding directions are influenced by wind (Fig. 6). Track and heading directions were more scattered under the head- and sidewind conditions in spring than under the tailwind conditions in autumn (Mann-Whitney U-test: track, Z = 10.96, n = 2515, P < 0.001; heading, Z = 6.14, n = 2515, P < 0.001). In spring, mean track (36°) and heading (28°) direction differed significantly (Watson-Williams test: F(1,3576) = 27.55, P < 0.01). In autumn, mean track and heading direction did not differ, but headings were more scattered than tracks (Mann-Whitney U-test: Z = 3.23, n = 726, P < 0.01). Tracks were extremely concentrated, following winds leading to a reduction of individual scatter in tracks.
Soaring-gliding flight
Theoretically, in optimal soaring-gliding flight, gliding airspeed is dependent on actual climbing rate in thermal circling, but is independent on wind direction and speed. Despite this fact, inter-thermal gliding airspeed showed a negative correlation to tailwind-component (Fig. 7). No correlation was found between climbing rate and tailwind-component and, thus, it has to be assumed that soaring conditions did not vary with wind conditions. A negative relation between gliding airspeed and tailwind-component was observed in various raptor species (Spaar 1997).
Flapping-gliding flight
In harriers, flapping-gliding flight was more often observed in spring under opposing winds than in autumn under tailwinds (Spaar & Bruderer 1997a). Levant Sparrowhawks adopted faster airspeeds in spring under headwinds (spring, 11.3 m s-¹; autumn, 9.6 m s-¹); accordingly, corresponding groundspeeds were lower (11.5 m s-¹, 13.0 m s-¹) (Spaar et al.1998). Enhanced airspeeds in headwinds make sense by reducing the negative influence of wind per unit energy.
Body mass related flight characteristics
Soaring and gliding characteristics
In Israel, climbing rates in thermal circling do not differ between different species (Spaar 1997). Mean values ranged from 1.48-2.08 m s-¹. Thus, climbing rates in thermal circling were determined by environmental conditions rather than by interspecific differences in morphology and biometry. Airspeed and gliding angle in gliding flight of the different raptor species were related to body mass: airspeed increased and gliding angle decreased with increasing body mass (Spaar 1997). Thus, gliding performance improved with increasing body mass: larger species had higher airspeeds and smaller gliding angles than smaller species. Mean airspeeds ranged from 13.50-17.02 m s-¹.
Migratory flight styles
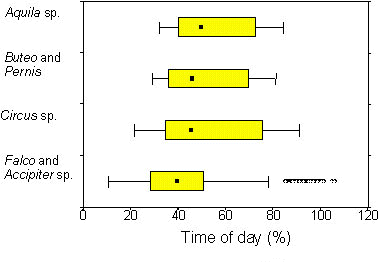
If thermal convection was suitable, the majority of the observed raptor species migrated by soaring-gliding flight. The cumulative proportions of gliding, circling and linear soaring flight ranged from 60-100% (Spaar 1997). There was a body mass dependent variation in the proportion of linear soaring and flapping-gliding flight: Soaring in straight line increased with body mass, with highest proportions in Short-toed Eagles (17%), Griffon Vultures (12%) and Steppe Eagles (11%) (Fig. 8). These large species mainly flew under optimal thermal conditions and their migratory flights were more or less restricted to the daytime hours with thermal convection (Fig. 9): in Aquila, Buteo and Pernis, 90% of the birds flew between 30-85% of daytime, i.e. they had a daily migratory activity of about 6-9 hours. On the other hand, proportion of flapping-gliding flight decreased with increasing body mass (Fig. 8). Levant Sparrowhawks (33%), small falcons (17%) and Montagu’s/Pallid Harrier (10%) had highest flapping proportions (Spaar 1997). Flapping-gliding flight occurred predominately after sunrise and before sunset (Spaar & Bruderer 1997a); smaller raptors, such as Falco and Accipiter sp., are thus able to extent their migratory flights to hours when thermal convection is absent or weak (Fig. 9).
DISCUSSION
Migratory raptors react to environmental conditions. In soaring-gliding flight, many species adopt thermal dependent airspeeds in agreement with theoretical predictions on optimal airspeed when maximizing cross-country speed. Thus, it is reasonable to conclude that many raptor species maximise cross-country speed in soaring-gliding flight. Pennycuick (1998) shows that the distribution of thermals may influence behaviour in soaring-gliding flight considerably: if thermal conditions are not optimal, birds can achieve higher cross-country speed by gliding more slowly than theoretical optimal airspeed because resulting cross-county speed is more affected by the time lost in thermal circling than by inter-thermal gliding airspeeds. If thermals are weak, small, infrequent or difficult to detect from a distance, the distance that a bird or a glider can cover in gliding becomes the most important factor (Pennycuick 1998).
Theoretically, gliding airspeed in optimal soaring-gliding flight is independent of wind speed and direction. Nevertheless, gliding airspeed was negatively related to the tailwind-component (Fig. 7). Similar to Pennycuick’s (1998) argument, I suggest that birds adopting lower airspeeds in tailwinds minimised height loss in gliding what enabled them to reduce time-consuming thermal circling. Birds may also maintain high flight altitudes for safety reasons: they enhance the possible gliding range and, thus, the chance to find suitable thermals.
There are fluent transitions from discrete thermals to thermal streets (Pennycuick 1998). In Israel, birds often had positive vertical speeds in inter-thermal gliding. Birds gliding across updraft zones reduced sinking rate in gliding. Lesser Spotted Eagles had lower sinking rates in inter-thermal gliding than theoretically expected. This is very similar to Steppe Buzzards (Spaar & Bruderer 1997b) and Steppe Eagles (Spaar & Bruderer 1996) under the same meteorological conditions. Lower sinking rates in inter-thermal gliding lead to higher overall cross-country speeds, because birds can reduce circling time in thermals. In this study, straight line soaring was assumed if positive vertical speeds lasted for at least 40 seconds; shorter periods were not separated from normal gliding. Thus, thermal columns were of considerable diameter; according to Hardy and Ottersten (1969), convective cells can exceed 1000 m in diameter. A frequent type of straight line soaring which is not considered here is soaring in dynamic updrafts along mountain ridges. At our observation sites there were no pronounced updrafts of this type, but lee-waves produced by downwind mountain ridges were responsible for some straight line soaring, particularly early in the morning.
The development and strength of thermals in the convective field are determined by several factors, the most important being the input of solar energy (Kerlinger & Moore 1989). The vertical extension of the convective field show a typical diurnal variation, with maximum height around noon and in the early afternoon (Kerlinger 1989). On days with cloud cover, insolation and convective activity are reduced (O. Liechti, pers. comm.). There is also a seasonal effect: in Tamanrasset (Sahara, Algeria), the upper boundary of the convective field reaches 4000 m a.g.l. from mid May until end of October, but only 2000 m a.g.l. from November to the end of February (Liechti & Lorenzen 1998). According to the convective activity, climbing rates in thermal circling and flight altitudes show a typical pattern during daytime, reflecting the strength of available thermals (Fig 2 and Fig 3). Strongest thermals appear around noon when insolation is highest. Predictions on convective activity show reasonable agreement with observed climbing rates in thermal circling (R. Spaar, B. Bruderer, O. Liechti, B. Neininger, pers. comm.). However, in the present study maximum flight altitudes of raptors in autumn were lower compared to the predicted upper boundary layer on most days, and no correlation was found between observed and predicted maximum flight level (Fig. 1). Since our observations in autumn did not cover the best soaring hours (i.e. 1100 to 1600), it is still an open question whether raptors used convective fields up to their limits. Flight altitudes of Broad-winged Hawks Buteo platypterus are correlated with the upper boundary of the convective field, whereas those of Sharp-shinned Hawks Accipiter striatus are not (Kerlinger et al. 1985). This is consistent with our findings that variation in flight altitude of soaring migrants like Aquila, Buteo and Pernis species reflected convective conditions, whereas those of smaller species, like Circus, Falco and Accipiter sp., were less related to convective activity because they additionally migrate by flapping flight under weak thermal conditions.
Satellite telemetry provides important data on overall migratory speeds and on diurnal timing of migration for a few large soaring individuals, whereas radar tracking allows to get reliable samples of flight data for different species under similar conditions. Comparing radar tracking and satellite telemetry data, cross-country speeds of Steppe Eagles in southern Israel are very similar (Spaar & Bruderer 1996): A juvenile Lesser Spotted Eagles reached highest daily progress of 289 km d-¹ between Turkey and Sudan; assuming 8-9 hours flight per day, it travelled at a speed of 32-36 km h-¹ (Meyburg et al. 1995). Radar tracked Lesser Spotted Eagles had cross-country groundspeeds of 34.4 ± 9.8 km h-¹ and airspeeds of 36.5 ± 8.9 km h-¹ (mean ± S.D.; n = 25; Spaar 1997). Migratory activity in Aquila sp. occurred during some 50-60% of daytime, corresponding to a daily flight activity of 6-9 hours; from radar data, the estimated daily progress of migration in Lesser Spotted Eagles was 150-400 km. Short-toed Eagles in southern Israel had cross-country groundspeeds of 39.5 ± 9.6 km h-¹ and airspeeds of 35.9 ± 7.6 km h-¹ (n = 9; Spaar 1997); they could cover a distance of 180-450 km d-¹ assuming the same flight activity as for Aquila sp.. Tracked by satellite, an adult Short-toed Eagle migrating along the western route crossing France, Spain, Marocco and Mali, made an average daily progress of 234 km d-¹ (range 17-467 km d-¹); in sunny weather, it reached an average of 311 km d-¹, whereas in cloudy and rainy days it was only 92 km d-¹ (Meyburg et al. 1998). On three occasions, exact cross-country groundspeeds of the satellite tracked Short-toed Eagle could be measured (37, 44 and 51 km h-¹), and these values correspond to those measured in Israel.
An other currently applied method to study soaring migration is to follow the birds by motor-glider. In Israel, Leshem and Yom-Tov (1996b) report cross-country groundspeeds of 29.2 km h-¹ in White Pelicans Pelcanus onocrotalus, 38.7 km h-¹ in White Storks Ciconia ciconia, 50.9 km h-¹ in Lesser Spotted Eagles and 45.2 km h-¹ in Honey Buzzards. These are similar to radar tracking data for White Storks (33.1-43.9 km h-¹; Liechti et al. 1996), but lower for Lesser Spotted Eagles (34.4 km h-¹; Spaar 1997) and Honey Buzzards (39.4-40.2 km h-¹; Bruderer et al. 1994; Spaar 1997). The lower cross-country speeds in our study are due to methodical differences: Leshem mainly flew with flocks under good thermal conditions, whereas our observations additionally covered days and daytimes with bad thermal conditions.
Biometrical characteristics also affect migratory flight styles. Proportion of flapping-gliding flight decreases with body mass. Hedenström (1993) shows that in time minimizing migration there is a body size dependent threshold to switch from flapping to soaring-gliding flight. The switch point depends on relative costs of flapping and gliding flight and on strength of available thermals. This model predicts that it is advantageous also for small raptors to change from flapping to soaring-gliding flight if suitable thermal convection is available. This is exactly what small raptors in Israel did: they migrated by flapping-gliding flight when thermal convection was weak or absent, but soaring-gliding was the predominate flight style during the good soaring hours of the day. The proportion of straight line soaring increased with body mass. It reflects the better gliding ability of larger species which had higher gliding airspeeds and smaller gliding angles in inter-thermal gliding than smaller species. This is compatible to aerodynamic theory: increasing wingspan reduces induced and profile drag in gliding (Pennycuick 1989), and higher wing loading of larger raptors (Mendelsohn et al. 1989) leads to higher gliding airspeeds. It is still unclear whether raptors minimise time- or energy demands during migration. According to Alerstam and Lindström (1990) migration already starts before migratory flights when birds build up their fat reserves. In raptors there is little knowledge on premigratory fattening, fat accumulation rates and feeding behaviour en route. However, feeding conditions are a very important feature when discussing migratory flight strategies. We calculated the energy and time requirements for different migratory strategies of Levant Sparrowhawks (Spaar et al.1998): a pure soaring-gliding flight strategy corresponds always to the energy minimizing strategy; for birds attaining low fat accumulation rates under poor feeding conditions en route, a pure soaring-gliding flight strategy is also the time minimizing option. Achieving higher fat accumulation rates, a time-minimizing bird should migrate by soaring-gliding flight at times with thermal activity and by flapping flight when convection is low or absent (i.e. at night). The considerable number of Levant Sparrowhawks migrating nocturnally may indicate time-selected migration (Stark & Liechti 1993; Spaar et al. 1998). Kjellen et al. (1997) suggest more time-selected migration in Ospreys Pandion haliaetus than in other soaring migrants because of constant headings across sea passages, mountain ranges and deserts.
Our present knowledge of raptor migration is a puzzle of different aspects and theories. Important relations between observation and theory have been highlighted so far. What is missing is a comprehensive view on energy, time and safety related factors in raptor migration. Besides flight behaviour, further investigations need to concentrate on feeding and stopover behaviour before and during migration in order to get insights into energy in- and output. The development of lighter transmitters in the near future will hopefully enable satellite tracking of smaller species, such as harriers, falcons or sparrowhawks; as migratory raptors of this size switch between soaring-gliding and flapping-gliding flight they are the ideal organisms to study time- and energy selected migration.
ACKNOWLEDGMENTS
This study was carried out when the Swiss Ornithological Institute was engaged in an environmental impact study on the potential hazard of a large antenna system in southern Israel. I thank B. Bruderer who headed the project, and Y. Baser, F. Baumgartner, A. Bole, S. Blitzblau, F. Liechti, M. Kestenholz, S. Marbach, D. Peter and H. Stark for field assistance. T. Steuri developed the software for operating the radars and for analysing the raptor tracks. B. Bruderer, M. Kestenholz, F. Liechti and L. Schifferli made valuable suggestions on the manuscript. This project was financially supported by the foundation of the Swiss Ornithological Institute, the contribution to the Int. Ornithol. Congr. by the Swiss Academy of Natural Sciences SANW.
REFERENCES
Alerstam, T. 1991. Bird Flight and Optimal Migration. Tree 6:210-215.
Alerstam, T. & Lindström, A. 1990. Optimal bird migration: the relative importance of time, energy, and safety. In: Gwinner, E. (ed) Bird migration. Berlin Heidelberg; Springer: 331-351.
Batschelet, E. 1981. Circular statistics in biology. London New York; Academic Press: 371pp.
Baudinette, R.V. & Schmidt-Nielsen, K. 1974. Energy cost of gliding flight in Herring Gulls. Nature 248:83-84.
Baumgartner, M. 1997. Wetterabhängigkeit des nächtlichen Vogelzuges im Herbst über Süddeutschland. PhD Thesis, University of Basel, Switzerland.
Bruderer, B., Blitzblau, S. & Peter, D. 1994. Migration and flight behaviour of Honey Buzzards Pernis apivorus in southern Israel observed by radar. Ardea 82:111-122.
Bruderer, B., Steuri, T. & Baumgartner, M. 1995a. Short-range high-precision surveillance of nocturnal migration and tracking of single targets. Isr. J. Zool. 41:207-220.
Bruderer, B., Underhill, L. & Liechti, F. 1995b. Altitude choice of night migrants in a desert area predicted by meteorological factors. Ibis 137:44-55.
Cramp, S. & Simmons, K.E.L. 1980. Handbook of the Birds of Europe, the Middle East and North Africa: The Birds of the Western Palearctic. Oxford; Oxford University Press.
Dunning, J.B.J. 1993. CRC handbook of avian body masses. Boca Raton; CRC Press: 371pp.
Ellis, H.I. 1984. Energetics of free-ranging seabirds. In: Whittow, G.C. & Rahn, H. (eds) Seabird energetics. New York; Plenum Press: 203-234.
Gatter, W. 1984. Nachtzug der Rohrweihe (Circus aeruginosus). Vogelwarte 32:309-311.
Hardy, K.R. & Ottersten, H. 1969. Radar investigations of convective patterns in the clear atmosphere. J. Atmos. Sci. 26:666-672.
Hedenström, A. 1993. Migration by soaring or flapping flight in birds: the relative importance of energy cost and speed. Phil. Trans. R. Soc. Lond. B 342:353-361.
Hedenström, A. 1997. Predicted and observed migration speed in Lesser Spotted Eagle Aquila pomarina. Ardea 85:29-36.
Kerlinger, P. 1989. Flight strategies of migrating hawks. Chicago; University of Chicago Press: 375pp.
Kerlinger, P. & Moore, F.R. 1989. Atmospheric structure and avian migration. In: Power, D.M. (ed.) Current Ornithology. Vol. 6; New York; Plenum Press: 109-142.
Kerlinger, P., Bingman, V.P. & Able, K.P. 1985. Comparative flight behaviour of migrating hawks studied with tracking radar during autumn in central New York. Can. J. Zool. 63:755-761.
Kjellen, N., Hake, M. & Alerstam, T. 1997. Strategies of two Ospreys Pandion haliaetus migrating between Sweden and tropical Africa as revealed by satellite tracking. J. Avian. Biol. 28:15-23.
Lasiewski, R.C. & Dawson, W.R. 1967. A re-examination of the relation between standard metabolic rate and body weight in birds. Condor 69:13-23.
Leshem, Y. & Yom-Tov, Y. 1996a. The magnitude and timing of migration by soaring raptors, pelicans and storks over Israel. Ibis 138:188-203.
Leshem, Y. & Yom-Tov, Y. 1996b. The use of thermals by soaring migrants. Ibis 138:667-674.
Liechti, F. & Bruderer, B. 1995. Direction, speed and composition of nocturnal bird migration in the south of Israel. Isr. J. Zool. 41:501-515.
Liechti, F., Ehrich, D. & Bruderer, B. 1996. Flight behaviour of White Storks Ciconia ciconia on their migration over southern Israel. Ardea 84:3-13.
Liechti, O. & Lorenzen, E. 1998. A new approach to the climatology of convective activity. Technical Soaring 22: 36-40.
Liechti, O. & Neininger, B. 1994. ALPTHERM, a PC-based model for atmospheric convection over complex topography. Technical Soaring 18:73-78.
Lustick, S., Battersby, B. & Kelty, M. 1978. Behavioral thermoregulation: orientation toward the sun in Herring Gulls. Science 200:81-83.
Mendelsohn, J.M., Kemp, A.C., Biggs, H.C., Biggs, R. & Brown, C.J. 1989. Wing areas, wing loadings and wind spans of 66 species of African raptors. Ostrich 60:35-42.
Meyburg, B.-U., Scheller, W. & Meyburg, C. 1995. Zug und Überwinterung des Schreiadlers Aquila pomarina: Satellitentelemetrische Untersuchungen. J. Ornithol. 136:401-422.
Meyburg, B.-U., Meyburg, C. & Barbraud, J.-C. 1998. Migration strategies of an adult Short-toed Eagle Circaetus gallicus tracked by satellite. Alauda 66:39-48.
Pennycuick, C. 1972. Animal Flight. London; Arnold: 70pp.
Pennycuick, C.J. 1975. Mechanics of flight. In: Farner, D.S. & King, J.R. (eds) Avian Biology. Vol. 5; New York; Academic Press: 1-75.
Pennycuick, C.J. 1989. Bird flight performance: a practical calculation manual. Oxford; Oxford University Press: 153pp.
Pennycuick, C. 1998. Field observations of thermals and thermal streets, and the theory of cross-country soaring flight. J. Avian. Biol. 29:33-43.
Reichmann, H. 1979. Streckensegelflug. Stuttgart; Motorbuch Verlag: 162pp.
Sokal, R.R. & Rohlf, F.J. 1981. Biometry. New York; Freemann: 859pp.
Spaar, R. 1995. Flight behaviour of Steppe Buzzards Buteo buteo vulpinus during spring migration in southern Israel: a tracking radar study. Isr. J. Zool. 41:489-500.
Spaar, R. 1996. Flight behaviour of migrating raptors in southern Israel. PhD Thesis, University of Basel, Switzerland.
Spaar, R. 1997. Flight strategies of migrating raptors; a comparative study of interspecific variation in flight characteristics. Ibis 139:523-535.
Spaar, R. & Bruderer, B. 1996. Soaring migration of Steppe Eagles Aquila nipalensis in southern Israel: Flight behaviour under various wind and thermal conditions. J. Avian. Biol. 27:289-301.
Spaar, R. & Bruderer, B. 1997a. Migration by flapping or soaring: Flight strategies of Marsh, Montagu's and Pallid Harriers in southern Israel. Condor 99:458-469.
Spaar, R. & Bruderer, B. 1997b. Optimal fight behaviour of soaring migrants? A case study of migrating Steppe Buzzards Buteo buteo vulpinus. Behav. Ecol. 8:288-297.
Spaar, R., Stark, H. & Liechti, F. 1998. Migratory flight strategies of Levant Sparrowhawks Accipiter brevipes: time or energy minimization? Anim. Behav. 56: 1185-1197.
Stark, H. & Liechti, F. 1993. Do Levant Sparrowhawks Accipiter brevipes also migrate at night? Ibis 135:233-236.
Fig. 1. Vertical extension (m above ground level) of the convective field in the Arava Valley in autumn 1991, derived from the numerical convection model «alptherm» (line). Median (black columns) and 90%-limit (whiskers) of daily flight levels of raptor migration are given.

Fig. 2. Flight altitudes of different raptor groups during daytime in southern Israel (0% = sunrise, 100% = sunset). Spring and autumn data combined. Maximum flight altitude per track. Boxes are medians with 25-75% quartiles, whiskers show 10-90% range; dots are outliers (i.e. outside the 1.5 box length from the upper and lower value).
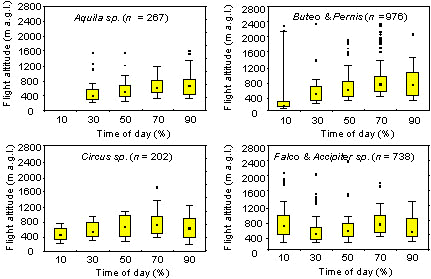
Fig. 3. Climbing rate, soaring time and height gain in completed thermal circling phases (n = 715). Boxes are medians with 25-75% quartiles, whiskers show 10-90% range; dots are outliers (i.e. outside the 1.5 box length from the upper and lower value).
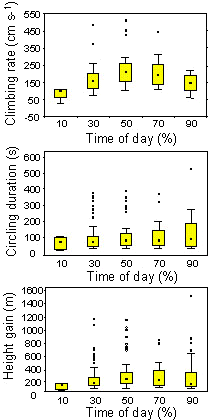
Fig. 4. Comparison of soaring-gliding flight in Lesser Spotted Eagles (n = 69) and theoretical predictions on optimal flight behaviour, calculated with the bird flight performance program of Pennycuick (1989). Dashed lines: regression lines of observed data. Solid lines: theoretical flight performance of an average Lesser Spotted Eagle (body mass 2 kg, wing span 1.8 m and wing area 0.49 m²): (A) line of thermal-dependent optimal airspeed Va(opt) if maximizing cross-country speed in soaring-gliding flight; (B) line of maximum cross-country speed Vcc(max) if adopting thermal-dependent airspeeds Va(opt) in inter-thermal gliding, and line of Vcc(bg) if adopting a constant airspeed of 10.1 m s-¹ providing best glide ratio (14.9); (C) theoretical glide polar.
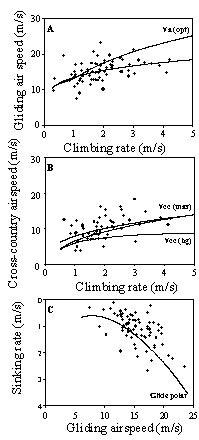
Fig. 5. Residuals of cross-country airspeed, gliding airspeed and sinking rates in inter-thermal gliding from the regression lines in Figs 4A-C. Cross-country airspeed versus gliding airspeed, y = 0.2 x + 0.5, n = 69, r = 0.3, P < 0.05; cross-country airspeed versus sinking rate, y = -0.05 x + 0.27, n = 69, r = -0.48, P < 0.001).
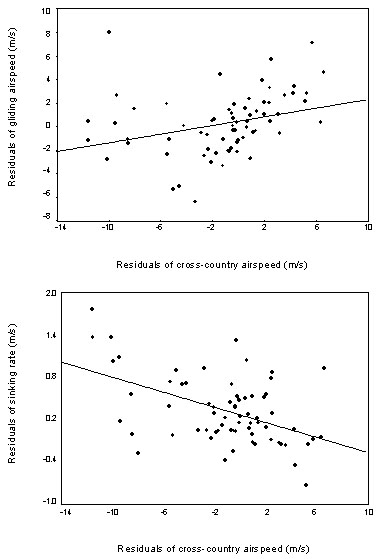
Fig. 6. Circular distribution of gliding (track and heading) and wind directions of raptor migration in spring and autumn. The corresponding distributions of winds are given as the direction towards which the winds were blowing at the flight levels of the tracked birds.
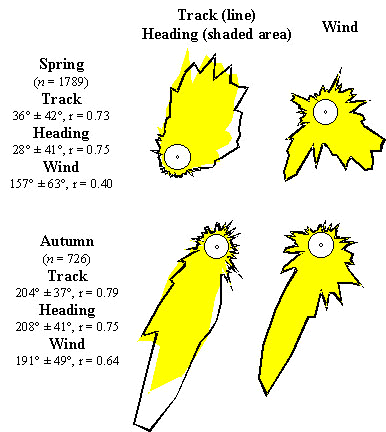
Fig. 7. Correlation of gliding airspeed and climbing rate in thermal circling with tailwind-component. Tracks without wingbeats only were analysed. Regression: gliding airspeed, y = -0.35x + 14.45, n = 458, r = -0.38, P < 0.001; climbing rate, r = 0.01, n.s..
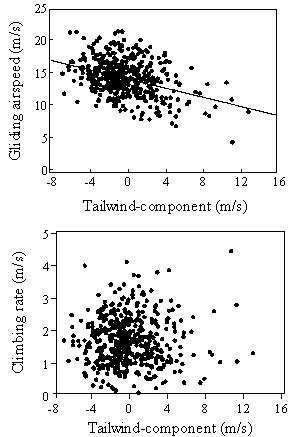
Fig. 8. Correlation of species average body mass (mean of males and females) and the proportion of soaring in straight line and flapping-gliding flight. Data of nocturnally migrating Levant Sparrowhawks and harriers are excluded. Body masses are from Cramp and Simmons (1980) and Dunning (1993). Regression lines: Soaring in straight line, y = 4.14x 0.73, n = 14, r = 0.81, P < 0.001; Flapping-gliding flight, y = 2.79 x -1.26, n = 14, r = -0.84, P < 0.001. Abbreviations: BE Booted Eagle (840 g), BK Black Kite (830 g), EV Egyptian Vulture (2120 g), GV Griffon Vulture (7440 g), HB Honey Buzzard (760 g), LS Levant Sparrowhawk (220 g), LSE Lesser Spotted Eagle (1370 g), MPH Montagu's/Pallid Harrier (350 g), MH Marsh Harrier (630 g), SB Steppe Buzzard (740 g), SE Steppe Eagle (2720 g), SF small falcons (220 g), StE Short-toed Eagle (1700 g); data from Spaar (1997).
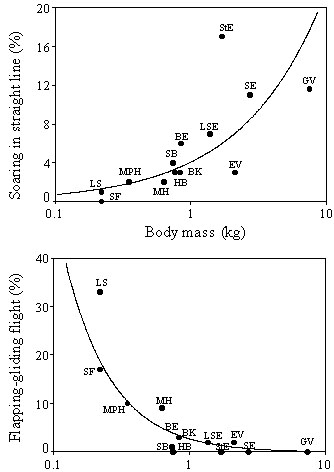
Fig. 9. Migratory flight activity during daytime in different raptor groups. Boxes are medians with 25-75% quartiles, whiskers show 10-90% range; dots are outliers (i.e. outside the 1.5 box length from the upper and lower value). Aquila sp. (n = 267), Buteo and Pernis sp. (n = 976), Circus sp. (n = 202), Falco and Accipiter sp. (n = 738).
