S31.1: On the power curves of flying birds
Jeremy M.V. Rayner1 & Sally Ward2
1School of Biological Sciences, University of Bristol, Woodland Road, Bristol BS8 1UG, UK, fax 44 117 925 7374, e-mail j.m.v.rayner@bristol.ac.uk; 2Department of Zoology, University of Aberdeen, Tillydrone Avenue, Aberdeen AB24 2TZ, Scotland, e-mail s.ward@abdn.ac.uk
Rayner, J.M.V. & Ward, S. 1999. On the power curves of flying birds. In: Adams, N.J. & Slotow, R.H. (eds) Proc. 22 Int. Ornithol. Congr., Durban: 1786-1809. Johannesburg: BirdLife South Africa.The power required for flight in any bird is a function of flight speed, but the nature of the relationship between power and speed has been the subject of much controversy. Some workers expect a U-shaped curve, while others have argued that the curve is J- or L-shaped, or that power varies little if at all with speed. Some of the problems with interpretation of the curves arise from lack of clarity about which components of the energy flow through a bird are being measured, while others may be traced to limitations of experimental conditions. A range of approaches to determining the power curve are reviewed, including the first simultaneous measurements of total energy input, gas metabolism, and aerodynamic and thermal energy output in a flying bird, made with the European starling Sturnus vulgaris in a wind tunnel at the Universität des Saarlandes. These measurements are reviewed in the context of other wind tunnel observations, and with the theoretical background to estimating power input and output based on flapping flight aerodynamics and flight muscle physiology. Accurate knowledge of the power curve is essential since extensive predictions of flight behaviour have been based upon it. The hypothesis that the power curve may not in fact exist, in the sense that the cost of flight may not be perceived by a bird as a continuous smooth function of air speed, has not formally been tested. This hypothesis is considered with evidence from variation in flight behaviour, wingbeat kinematics and flight gait with speed.
INTRODUCTION
The ‘power curve’, expressing the relationship between power consumption and air speed, has become the central icon of the study of animal flight. It represents a convenient expression of the biomechanical or physiological performance of a flying animal, and is valuable as a tool for comparing flight patterns or behavioural strategies. Insights into, for instance, decisions about flight speed or the optimum strategy for feeding and migration have been gained from theoretical analyses of the power curve (see, for example, Rayner 1985a, 1990; Hedenström 1995, Hedenström & Alerstam 1995, Houston 1992, Weber & Houston 1997). None the less, power curves have become surrounded by a degree of controversy. In this paper, we review the mechanical and physiological background to power curves, attempt to clarify some matters surrounding their definition, and use some recent direct measurements to define what is and is not known about their shape and their interpretation.
Several methods have been used to determine the power curves of different species of birds. Direct measurement of total energy uptake or of components of energy output by the bird can be made during flight in a wind tunnel at controlled speeds. These experiments (reviewed briefly below) have been applied to a limited range of species. Only recently has there been any attempt to validate alternative techniques or to quantify the relationship between the quantity measured and the components of energy flow through the bird. Perhaps their most serious limitation is that they cannot readily be extrapolated from one species to another, and there must always be doubt about the similarity between the controlled but possibly stressful conditions in a wind tunnel and natural, free flight. For this reason numerous authors have relied upon theoretical approaches to the power curve. The ready availability of such models and the ease of extrapolation from other measurements tempts application of model calculations without sufficiently close attention to the assumptions of the models or to the limitations of the underlying physical and physiological mechanisms involved. Mathematical models of different degrees of complexity have been derived to predict power consumption as a function of flight speed (and maybe of other quantities such as climb angle and acceleration), and of bird morphology. The nature of the model appropriate for any particular problem must vary according to the goal of the analysis. Sophisticated unsteady aerodynamic analyses may be required to understand the performance of flapping wings, to interpret patterns of wingbeat kinematics or to understand wake vortex development. At the other extreme, much simpler models with diminished sensitivity to aerodynamic quantities such as wing and body morphology may be sufficient for understanding behavioural decisions in flight (e.g. Hedenström & Alerstam 1995; Thomas 1996).
MODELLING POWER CONSUMPTION
The favoured approach to modelling power consumption and deriving power curves has been to attempt to partition separate rates of energy flow leaving a bird into its environment. The energy rates involved can be large: empirically, total power consumption in steady, level, continuous flapping flight ranges from 10 up to as much as 20 times basal metabolic rate. Much of the morphological structure of a bird reflects the dominant role of flight in determining avian evolution and life history, and therefore the starting point for these models has been taken as the mechanical or aerodynamic costs of flight. This component of power can be expressed formally in two ways, which are formally not identical but which should not differ greatly, and with the experimental resolution we presently enjoy are effectively equivalent. According to the first, mechanical power is determined as the rate of increase of kinetic energy of the air owing to the passage of the bird; in the second it is the mechanical work performed by the flight muscles at the shoulder joint. The first, and rather simpler, formulation opens the way to modelling mechanical power output by methods derived for low-speed aircraft. The second definition recognises that work is done in flight only by the muscles that flap the wings; it is valuable in that it emphasises the need to incorporate the considerable energy released as heat by the flight muscles as they generate mechanical work, but under this approach this component is not measured or estimated directly.
The energy budget of a bird is determined by the total power output, and it is presumably the sum of all energy flows leaving the bird that has the greatest influence on flight and foraging decisions, and the like. It is essential to distinguish this metabolic power from the mechanical component identified above. It seems that the conventional approach to determine total metabolic power was outlined first by Marey (1890), but it will be most familiar from the model of Pennycuick (1968, 1969, and subsequently modified or reformulated by Tucker (1973, 1974, 1975), Greenewalt (1975) and Pennycuick (1975, 1989)). In this approach a value is assumed for the efficiency of the generation of mechanical work by the flight muscles, and this is used to estimate the energy input to and the heat output from the muscles. To this are added components for basal metabolism and postural metabolism (the increment to power to drive respiration, heart rate, etc., associated with flight activity), to reach a value of total metabolic power output (Appendix 1b). This partitioning of energy flows out of the bird is illustrated diagrammatically in Fig. 1. It must be emphasized that there is no physiological basis for partitioning total energy in this way, and the internal physiological functions of the bird in flight remain poorly understood. Further, values typically used for flight muscle efficiency or postural power in flight are supported by little more than minimal experimental evidence or inspired guesswork.
Aerodynamic models
With the technological quest for powered flight during the nineteenth and early twentieth centuries, many workers looked closely at the aerodynamics of birds as inspirations for the optimum design for aircraft. Some of the morphological deductions made at this time proved to be considerable successes—Otto Lilienthal could not have flown the first (proven) glider without his studies of bird flight (1889)—but the many attempts to estimate aerodynamic force or mechanical power in flight (e.g. De Labouret (1889), Ahlborn (1896), Winter (1895)) were doomed to failure until the formulation of the Prandtl–Zhukovsky–Lanchester lifting-line explanation of wing action and vortex formation in around 1910 (Fig. 2; Appendix 1; Prandtl 1918). Early applications of that method to bird flight (e.g. Wieselsberger 1914) were restricted to fixed wing problems. Some subsequent models directed to flapping flight have continued to use the lifting aerodynamics of fixed wings (Pennycuick 1968, 1969; Tucker 1973; Greenewalt 1975).
It was a further 10 years until the first theoretical models of flapping flight were published (e.g. Fullerton 1925; Walker 1925, 1927). Their approach of modelling individual wing sections as lifting aerofoils each behaving in the same way as a fixed wing has since been combined with advances in the understanding of flapping wing and unsteady aerodynamics, and rightly remains the basis of subsequent models of flapping bird flight (e.g. von Holst & Küchemann 1941, Cone 1968, Beterridge & Archer 1974, Archer et al. 1979, Rayner 1979a, b, 1986, 1993; Phlips et al. 1981; De Laurier 1993); these various approaches are termed lifting-line, blade-element or free-vortex methods. There is ample experimental evidence that bird wings function analogously to fixed-wing aerofoils, and generate weight-supporting and thrusting trailing vortices just as a fixed aircraft wing generates a lifting vortex (e.g. Rayner 1995a). Flying animals are subject to the important distinction from aircraft that they generate thrust, in addition to a force supporting their weight, by flapping their wings.
It is in one of the earlier contributions to this tradition that we find the first published power curves for birds. Gnosspelius (1925) modelled the mechanical performance of a range of birds as if they were fixed wing aircraft (Fig. 3), and plotted curves of performance against speed, albeit in a somewhat curious arrangement to modern eyes. The details of the computation were not given, but the method was evidently based on Prandtl’s lifting-line theory.
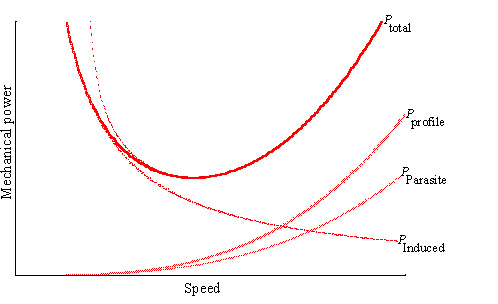
The power curve for a fixed wing aircraft has a characteristic U-shape (Fig. 2). This is a direct consequence of the aerodynamic forces acting on the wing section aerofoils. It has this characteristic shape because the air flows, forces and energies required to fly have to separable components. The energy required to generate wake vortices to support the weight (the induced power) falls with speed (as 1/speed), while the form and friction components of body parasite and wing profile drag rise approximately as speed cubed. (It should be noted that the aircraft lifting-line model takes no account of the aerodynamic efficiency of the propeller or jet in generating thrust; this represents an additional, and sometimes significant, mechanical cost.) Both induced (vortex) and frictional drag forces act on a bird in broadly similar relative magnitudes to those acting on aircraft, allowing for the difference in size: induced drag dominates at low speeds, and friction drag dominates at high speeds. Given this important parallel, and the similarities in the models used, it is not surprising that all models aimed at computation of the mechanical power consumption of birds in flapping flight predict broadly similar power curves. All such models agree that the mechanical power output varies with flight speed according to a U-shaped curve.
The most widely used model is that of Pennycuick (1968, 1969, 1975, 1989). Like other models it is derived from fixed wing lifting-line theory. Pennycuick formulates the lifting component of his model in terms of a momentum jet (which is more familiar from propeller and helicopter theory), but in the earlier forms of his model he considers only the weight-supporting component of the induced power (compare Appendix 1). Visualisation of bird wake vortex structures (Rayner 1995a, etc.) have confirmed Rayner’s original prediction (1979b) that in forward flight flapping wings cannot generate a continuous, steady momentum jet, or any structure analogous to it. For a fixed wing, the lifting-line and momentum jet models give algebraically identical results (Prandtl & Tietjens 1934); although both are different interpretations of the same physics, Prandtl’s lifting line formulation is a more realistic description of the vortex wake. It is therefore advisable to class Pennycuick’s model as based on lifting-line theory; this also serves to emphasise its heritage in fixed-wing aircraft practice. Certain limitations in the application of Pennycuick’s and related models are discussed below.
There remain some subtle but important differences between bird and aircraft models. These arise from the fundamental aerodynamic difference between the two modes of flight, which is that birds must flap their wings to generate both weight support and thrust; aircraft wings need generate only lift, and aircraft obtain thrust by essentially separate engines. The vortices in the wake must also convect momentum to provide thrust as well as supporting the weight, and therefore induced power must include the additional cost of generating thrust (Fig. 4). This important fact has been largely ignored in Pennycuick’s model, but is a distinctive element of Rayner’s vortex ring (1979a, b) and unsteady lifting-line (1986, 1993) models, which are intended to be applied to different flight patterns; it is also implicitly an important component of their models of flapping wings (e.g. Archer & Betteridge 1979, Phlips et al. 1981). The distinction is that induced power does not decline as the inverse of speed, but at higher speeds rises slowly to reflect energy converted to wake momentum which is responsible for thrust. Pennycuick (1995) inveighed against the complexity of models of this kind, claiming they needed too many unjustified assumptions. This is to misunderstand the nature of modelling in biology: the aim of models of flapping flight aerodynamics is not excessive simplicity as an aid to the prediction of power for ecological modelling, but is to attempt to understand the mechanisms of force generation by flapping wings. Power is a valuable currency to compare different birds or different flight patterns, but is a bonus from the models, not their only goal. It should however be noted that there are few material numerical differences between predictions from the different models when applied with similar parameters and assumptions.
The profile power, the rate of working to overcome wing profile drag, is also higher in flapping than for the equivalent fixed wing. This is to be expected since the local air speeds around a flapping wing are higher. Pennycuick (1969) proposed that profile power should be approximately constant, independent of speed, in flying birds; this has since become a characteristic component of his model. Pennycuick’s argument makes two assumptions. First, that wingbeat kinematics must vary as speed varies, resulting in a variation in the local speed of the wing, which may not be directly proportional to flight speed. Second, lift coefficient varies with speed, and this results in a variation in profile drag coefficient by a mechanism known as boundary layer thickening. Combining these two effects, Pennycuick concludes that profile power is roughly independent of speed. The first mechanism is undoubtedly correct, but its effect (incorporated in the computations in Fig. 4) is small at low speeds, and in practice tends to steepen the rise of profile power against speed. The second is no more than plausible, but is supported by limited experimental evidence; measurements may have confounded components of induced and profile power, and observations on gliding wings cannot be extrapolated to flapping flight where lateral flows over the wings become important. In flapping flight, the presence of intense localized vortices on or around the wing could as readily reduce profile power by boundary layer thinning in response to strong spanwise or chordwise pressure gradients A further complication is that Pennycuick has not given a detailed mathematical formulation for his model of profile power, and since its first introduction the factor used in his simple computational method has been changed although no justification has been given. No other worker on flight aerodynamics has accepted this formulation of profile power, and all others have agreed with conventional theory that an asymptotic increase in profile power approximately as speed cubed is inescapable.
Profile power remains the least understood of the components of aerodynamic power in flight, partly because of lack of knowledge of possible drag-modifying mechanisms, and partly because the profile drag coefficient has not been measured in vivo in flapping flight. Until reliable measurements of profile drag coefficient for a range of bird wings in flapping flight become available, the only available strategy must be to assume that the coefficient is constant, with values derived from measurements of fixed bird wings (Rayner 1979a,b).
Modelling metabolic power
With the reservations above, all available experimental evidence indicates that the aerodynamic models correctly describe the essential physical processes involved, and that, in general, the parameter values proposed are reasonably realistic (though see below). It is unlikely that predictions of mechanical power output from these models are greatly inaccurate. It is on the other hand unlikely that the models have sufficient sensitivity for many of the applications to which they have been put.
The apparent ease of estimating metabolic power from aerodynamic power has tempted several workers to extrapolate from mechanical power to a total metabolic power, by the strategy outlined above and in Appendix 1b. Tucker (1973) and Pennycuick (1975, 1989) assumed a fixed value of 0.23–0.25 for flight muscle efficiency, and modelled postural power as a constant fraction of mechanical power. There is no direct experimental evidence for either supposition. Tucker (1973), Greenewalt (1975) and Pennycuick (1989) adopted the less justified—and methodologically circular—practice of determining some of the unknown aerodynamic parameters by fitting estimated power to the limited then available direct measurements of energy uptake. While this ensures that the models give good estimates of power for some birds in some conditions, it discards any insight into the underlying functional processes or into physiological or biomechanical adaptations which may be unique to any individual species, and provides no mechanism for checking either the model or the measurements from which it is extrapolated. Models with non-independent parameter estimation cannot be abstracted to other species with any confidence.
The fundamental assumption of this method of estimating total metabolic power should be questioned. The mechanical component of power can be defined rigorously as the mechanical energy leaving the bird and performing aerodynamic work in flight. The additional—and larger—component released as heat originates from a range of processes which are poorly understood in a flying bird with very high levels of physiological activity. It is probably not justified to assume that basal metabolism, ‘posture’ (if such a quantity exists) and energy leaving flight muscles are independent. Heat released from the flight muscles may be employed for other internal physiological functions (thermoregulation, in particular). There is an important mechanical linkage between thoracic muscle activity and respiration (Jenkins et al. 1988), and driving this mechanism may represent an additional energy cost. The greatest limitation to this procedure is the flight muscle efficiency, which has not yet been measured directly in birds. There is insufficient independent basis for the values of flight muscle efficiency commonly used, and as argued here the partition of muscle energy output into ‘useful mechanical’ and ‘waste heat’ is oversimplistic. Flight in tilting wind tunnels cannot be used to estimate flight muscle efficiency since this method fails to take account of the differential costs of thrust generation at different flight angles (Rayner 1986).
The whole animal efficiency introduced by Ward et al. (1999b) circumvents some of the limitations involved in partitioning metabolic energy. This empirical quantity has no direct physiological basis, but summarises all components of energy released by the bird not attributable to flight mechanics; it is a convenient way of expressing the relationship between mechanical power and the much larger metabolic power output. Comparison of measured metabolic and computed mechanical powers (Rayner 1995b) suggests that whole animal efficiency increases sharply with size (as approximately mass to the power 0.25), and may be lower than 10% in the smallest birds. Values as low as 10% have been measured in hovering hummingbirds (Chai & Dudley 1995). If Pennycuick’s (1975) methods and values for estimating postural and basal metabolic powers are accepted, then muscle efficiency for most birds must be smaller than 0.25, falling probably in the range 0.1–0.22; the higher values are achieved only in the larger flapping birds. Direct measurement (described below) in starlings suggests that in this species whole bird efficiency is in the range 0.12–0.18, and that flight muscle efficiency rarely exceeds 0.2. Interestingly, and further compromising attempts to extrapolate from mechanical to metabolic power, whole animal efficiency increases with flight speed over the range of speeds measured.
A promising resolution to this problem may come from more realistic modelling of the physiological processes involved. A recent analysis explains the observed scaling of metabolic power output and efficiency with body size across the range of birds on the basis of the morphology and activity of hearts, lungs and mitochondria (Bishop 1997, Bishop & Butler 1995). This approach does not yet have the resolution or the necessary supporting measurements to attempt to predict speed variation in efficiency or the physiological components of total power output.
DIRECT MEASUREMENT OF POWER OUTPUT
Measuring metabolic power output
The alternative to theoretical modelling is direct measurement of power output. The various techniques employed for determining total power output (mass loss, gas exchange, labelled isotopes) are well known, and the available methods and results have been reviewed by several authors (see, for example, Masman & Klaasen 1987, Rayner 1990). All of these techniques have been employed with birds and some bats flying in wind tunnels to determine power curves (Fig. 5).
Measurement of power output in wind tunnels is a complex process, generally requiring extensive training and some good fortune for a bird to fly readily. Some individuals and some species adapt far more readily to wind tunnel flight than others. The environment is unavoidably different from that in which a bird would normally fly, and may be both acoustically and aerodynamically noisy; it may also be stressful, particularly if a bird is required to fly with a respiratory mask. The aerodynamic boundaries of the wind tunnel alter the airflow in the wake, and distort the mechanical power required to fly (Rayner 1994a). The boundaries also encourage behavioural strategies, such as intermittent gliding or flying near the upper boundary of a closed tunnel, which can reduce the mechanical power required to fly (Rayner 1994a). Flight patterns of birds in wind tunnels, even if sustained for extended periods, are often somewhat unsteady. It is therefore difficult to be certain how closely the results of wind tunnel experiments can approach the power—speed curve of a bird in natural free flight. While in principle it is possible to correct for aerodynamic effects on mechanical power, in practice the corrections are complex and difficult to apply with any accuracy. What this does mean is that it may be unjustified to compare a measured power curve with a theoretical one computed from a model that assumes undisturbed free flight. This does not diminish the value of the wind tunnel as an experimental tool for the study of physiological and aerodynamic processes in controlled conditions, but it does stress the importance of controlling for as many of the distorting effects of the wind tunnel as possible before assuming that results obtained in wind tunnels correspond to flight in the wild.
Measuring aerodynamic power output
In principle, it should be possible to measure induced power output directly by sampling the wake of a flying bird. So far, this has been achieved only in birds flying in still air at uncontrolled speeds (Rayner 1995a), but similar methods should work in a wind tunnel provided the airflow is of high quality.
A method that has been applied with some success is determining the mechanical power output from the flight muscles, by implanting miniature strain gauges on the delto-pectoral crest of the humerus of a Magpie Pica pica (Dial et al. 1997). Initial results with this technique predict appreciably mechanical power remarkably close to that obtained from aerodynamic modelling (JMVR, unpublished results). Remaining discrepancies may be explained by the absence of direct aerodynamic observations on Magpies, and by the fact that the strain gauge measures energy responsible for displacement of the humeral crest, but not for rotation (sensu. Poore et al. 1997), although rotation provides a major component of wingtip movement and therefore aerodynamic force generation. In future, it is likely that these limitations will be resolved, and this will represent a powerful method for comparison with measurement of aerodynamic and physiological power outputs.
The shape(s) of power curves
The greatest controversies surrounding the available measured metabolic power curves have been concerned with their shape. Measured curves rarely conform to the smooth U-shape expected from aerodynamic models, and some differ markedly. The published measurements, shown in Fig. 5 and Fig. 6A, reveal some of the difficulties, particularly when shown in the size-corrected form of Fig. 5B. Some species—such as the budgerigar Melopsittacus undulatus—have clear U-shaped curves, while others are flatter (even allowing for the foreshortening for the curves for smaller species in the top view). Most species show a minimum in the curve at or around the expected minimum power speed and a rise in power at higher speeds, but the rise is often shallower than expected from a rise in aerodynamic power as speed cubed. Few measurements have been made in slow flight, where birds are often reluctant to fly, and therefore the rise in power expected at lower speeds is missing. Among the flatter curves, the starling Sturnus vulgaris, measured by Torre-Bueno & Larochelle (1978), is conspicuous, with only marginal measured increase in power up to the highest speeds. Recent experiments with this species (below; Fig. 6A) show a more normal rise in power with speed, and the older measurements may be discounted as anomalous, perhaps due to the use of a sealed wind tunnel of very small cross section.
A number of possible explanations have been advanced for the differences in shape between the animals studied, and between some of the measured curves and the expected U-shape. Ellington (1991) has argued that curves should be J-shaped, because in the hummingbirds Colibri sp. minimum power is close to that measured in hovering, in the same species by the same author. The induced power required to support the weight in hovering is considerable (Rayner 1979b), and for the curves to be J-shaped it would be necessary for the birds to be remarkably inefficient in forward flight. There is no evidence to support this. These hummingbird hovering and forward flight measurements were made in very different circumstances and cannot be compared (Rayner 1994a), so this observation may be set aside. (J-shaped power curves may however be applicable to insects.) In those other cases where power has been measured at low speeds, a modest rise as speed falls is apparent.
An alternative description of the shape of the power curve has recently been proposed by Dial et al. (1997) (see also Alexander 1997): their measurements of mechanical work at the shoulder joint of a Magpie Pica pica rise only modestly towards higher speeds, and do not increase to values comparable to those measured in hovering. They interpret this as being L-shaped. This may be a matter of interpretation, since estimates of aerodynamic power for this species give comparable values and a similar curve shape (this is due to changes in wingbeat kinematics with speed in this species with very broad, rounded wings). The curve could equally be described as a segment of a very shallow U.
Many claims have been made about the shape of metabolic power curves, but in practice relatively little can justifiably be said about their shape. Some authors (for example Kvist et al. 1998) have observed minima in power-speed curves which were sufficiently obvious for them to be able to identify a definite minimum power speed; this speed would not exist for flat, J- or L-shaped curves. Others have claimed that curves are flat, without testing shape statistically. A test that power is not correlated with speed (for instance by determining a regression slope which does not differ from zero) does not rule out consistency with a U- or J-shaped model; the only case when regression can be useful is when it demonstrates a significant rise in power with speed towards the upper speed range, representing a segment of a U-shaped relationship (see below). The null hypothesis that power is independent of speed is in any case inappropriate since it has no basis in the physics of flight. The null hypothesis should be that the curve does not differ from a predicted U-shape. However, formal testing of this hypothesis is not straightforward. Fitting curves such as a parabola
![]()
or in the form of the ‘expected’ mechanical power curve
![]()
with arbitrary parameters a, b, g or
V0 are of little value since the confidence limits for estimation of the parameters fitting curves of this kind are typically very broad. Parameters estimated in this way cannot be used to quantify physiological or aerodynamic processes, and estimations of minimum power speed from fitted curves can be unreliable. The only meaningful statistical test of power curve shape is to compare (by Analysis of Covariance) the accuracy of the fit between measured and estimated powers; however, this is usually not feasible since, as explained above, parameters for metabolic power modelling are not known with sufficient reliability. If such tests are performed for the experimental data in Fig. 5B using Pennycuick’s (1989) model, none of the fits reaches significance (JMVR, unpublished results).AN INTEGRATED APPROACH TO STARLING ENERGETICS
The major barrier to further analysis of existing metabolic power curves is that studies have rarely been able to perform all appropriate controls, and often essential information for more detailed aerodynamic analysis is lacking either from the individual studies or from the models. To circumvent as many of these difficulties as possible, we have conducted a comprehensive series of experiments with European starlings Sturnus vulgaris. We measured power components by a range of methods in the same group of animals both in the field in Scotland and in a wind tunnel at the Universität des Saarlandes at Saarbrücken in Germany. The starling is an appropriate study animal since it is often adopted as a test species in behavioural and field ecology, its life history is well understood, and previous measurements of flight power have been published. One goal of the study has been to reassess the metabolic measurements of Torre-Bueno & Larochelle (1978), which by comparison with measurements for other birds appear anomalous. Full details of this work will be published elsewhere (Ward et al. 1998, 1999a, b, c); our results about starling power curves are briefly summarised here.
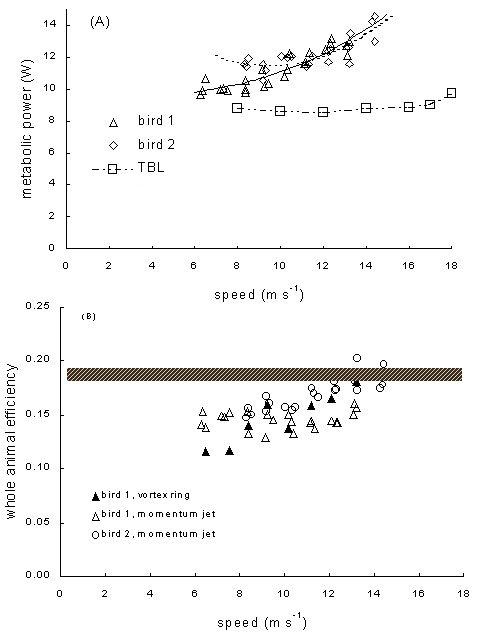
The most important finding is that measurements of total metabolic power output over a range of flight speeds by both oxygen uptake (Fig. 6A) and labelled isotope metabolism give similar values, and show a modest and statistically significant rise with speed (O2 uptake: F1,19 = 24.3 for Bird 1, F1,,22 = 102.5 for Bird 2); only the portion of the power curve around and above the minimum power speed of about 7 m s-1 was measured. These experiments are the first to use labelled water to assay metabolism in a wind tunnel, and to validate this technique with direct measurement of gas exchange in an active flying bird, and successfully confirms that this less-invasive technique is viable for birds provided that flight times of about one hour or greater can be achieved. The measurements are also congruent with labelled water measurements in the field (Ward et al. unpublished results; ca. 9 W, Westerterp & Drent 1985), suggesting that distortion introduced by the wind tunnel, in starlings at least, is modest. Our birds exploited tunnel boundary effects by flying near the upper surface of the working section, and at higher speeds used undulating (flap-gliding) or bounding (flap-bounding) flight (Rayner 1985b) extensively to reduce mechanical power, possibly to compensate for increased energy costs associated with flight inside the tunnel. Our measured power in the wind tunnel markedly exceeds the values previously published by Torre-Bueno & Larochelle (1978), especially at higher speed; we have insufficient information about the wind tunnel used in those earlier experiments to explain the discrepancy, but we are confident that those measurements are not representative, and that starlings do not have a ‘flat’ power curve.
Simultaneously, we estimated mechanical power from wing morphology by Pennycuick’s (1989) model with default parameters, and used measured wingbeat kinematics (U. Möller, unpublished results) to determine mechanical flight power by Rayner’s (1979a) vortex ring model (Ward et al. 1999b). The values obtained for mechanical power from the two models did not differ substantially, but metabolic power from Pennycuick’s model was not a good fit with the measurements. The mechanical and metabolic measurements can be reconciled if whole body efficiency is lower than expected, and rises with flight speed. It lies in the range 0.11–0.15 at lower flight speeds, rising to 0.17–0.20 at higher speeds. In Bird 1 with the vortex ring model, and in bird 2 with the lifting line model, increases in efficiency with speed are significant (Fig. 5B). If basal and postural metabolism are estimated following Pennycuick (1989), then only at the highest speeds does flight muscle efficiency exceed 20%. It has long been recognised (e.g. Rayner 1979b) that efficiency can depend on flight speed owing to changes in wingbeat kinematics and therefore in muscle kinetics. We do not expect efficiency to rise indefinitely at higher speeds, but have no measurements to indicate the location of its maximum.
This is the first experimental demonstration that efficiency depends on flight speed. It would be unwise to extrapolate our finding that highest efficiency in starlings occurs at higher speeds to other species. Efficiency is likely to be adaptive, and birds may have evolved to have optimal efficiency associated with speeds or flight patterns appropriate for their life style.
We also employed the novel method of digital video thermography to quantify the heat released by the bird (Ward et al. 1998, 1999c). This heat should be the difference between the total power (as measured by oxygen uptake under steady conditions) and aerodynamic or mechanical power output. Further analytical work is still required to refine our technique of estimating heat transfer by aerodynamic convection, but our initial results show that thermal power is slightly lower than measured metabolic power (above), and is sufficiently close to the difference between measured metabolic and mechanical power to give us confidence that this method has considerable promise as a non-invasive technique for both captive and free-flying birds.
DISCUSSION
Application of power models
In this review we have identified a number of limitations to the current knowledge of power curves. Most of these stem from the mismatch between aerodynamic models and metabolic measurements, and from overconfidence in attempting to model physiological processes as a complement to broadly realistic aerodynamic models. There is no experimental basis and no direct practical evidence for partitioning metabolic (i.e. non-flight-mechanics) energy flows from an active flying bird.
By comparison, the physical principles of the aerodynamic components of existing models appear to be relatively robust, and consistent with aerodynamic measurements and observations. It is unlikely that currently available theoretical estimates of induced power in cruising flight are significantly inaccurate, even if novel unsteady aerodynamic mechanisms are involved in lift production, since they are based on momentum structures in the wake for weight support. There are doubts about the appropriate values for modelling both profile and parasite drags, but at low speeds these are relatively small components of total power consumption. Unfortunately some other aerodynamic parameters required by the models are little more than educated guesses based on limited experimental evidence. Pennycuick (1989, 1995) encourages adjusting certain parameters so that mechanical curves fit experimental measurements or other expectations. This strategy cannot be recommended.
Much greater concern surrounds physiological quantities such as non-flight metabolism and flight muscle efficiency (summarised in our whole body efficiency), which currently can be determined with confidence only by simultaneous measurement of metabolic and mechanical power components, as described here. This strategy means that any uncertainty in aerodynamic parameters will be translated into uncertainty in efficiency. Recently, Pennycuick et al. (1996) have proposed that body drag estimates in Pennycuick’s (1975, 1989) model are too high by as much as a factor of eight; the possibility that profile power is misestimated was not considered, and this value was obtained by adjusting parameters to obtain a visual fit to the power curve. Ward et al. (1999b) demonstrated that a correction of this magnitude significantly depresses whole body efficiency in starlings even further below normally assumed values. Recent measurements of body parasite drag in model (Gesser et al. 1999) and real Starlings (W. J. Maybury and JMVR, unpublished results) indicate that current allometric estimates of parasite drag (Tucker 1973, Pennycuick 1989) overestimate the true values by a factor of 3–4.
With the present level of accurate knowledge of input parameters for the aerodynamic models, estimation of maximum range and minimum power speeds which characterise the power curves (Pennycuick 1969, Rayner 1985a, 1990; Hedenström & Alerstam 1995) is relatively unreliable since the minima of both mechanical and metabolic power curves are rather shallow. Welham (1994) has shown that models do not predict flight speeds well, and Rayner and others (see Rayner 1994b) have established a systematic bias in estimation of characteristic powers which can be explained by size-dependence of whole body efficiency. It was explained above that Pennycuick’s model does not give a good fit to measured metabolic power curves.
Flight behaviour and the power curve
Mechanical power curves are usually computed for an animal in straight, steady, level flight. If they are extrapolated to estimate metabolic power, then there is the further implicit assumption that the bird has reached a physiological equilibrium, and oxygen uptake balances fuel and substrate use and energy released. In short flights a bird is likely to travel slowly, and energy is likely to be particularly high. In short flights the respiratory quotient is often relatively high (Rothe et al. 1987), and it may take an extended period for a bird to reach optimal, that is lowest, levels of metabolism. Total power measured in slow flights is appreciably higher than power in cruising flight (Rayner 1990). In cruising flight birds do not always fly steadily. Many species accelerate and decelerate in response to gusts or other disturbances, and many use intermittent flight strategies with periodic bursts of climbing or acceleration, or of gliding or of bounding flight with the wings folded (Rayner 1985b). Birds flying close to the ground can benefit from aerodynamic ground effect, with a marked saving in induced power. Birds in wind tunnels frequently fly unsteadily, and exploit properties of the air flow close to tunnel boundaries to reduce mechanical power by a mechanism comparable to ground effect. Birds can also adjust the geometry of their wing planform to expand their flight envelope (Thomas 1996), and during a long flight, weight may change (Rayner 1990).
For all of these reasons it is not realistic to think of a bird as exploiting a single power curve. The steady flight power curve predicted with ‘average’ morphology by aerodynamic models is one of a family of power-speed-behaviour relationships, and is not necessarily the minimum power at any or every speed. It may also not be the preferred power, or power may not be the appropriate currency or decision criterion setting flight styles. A curve sampled in a wind tunnel or by other experimental techniques may therefore not correspond to an ideal modelled curve. Some species may have a broad range of flight strategies and may have the flexibility to optimise their flight patterns according to behavioural criteria. Other species may be more constrained. For instance, Rayner (1985b) argued that smaller birds using bounding flight have to adopt this flight strategy because of physiological constraints on the variability of power output from the flight muscles. Power models can in principle be extended to incorporate these flight patterns to determine more precise power curves (Rayner 1985b¸1986, 1991), but some degree of uncertainty in comparison with measured curves is inevitable.
Meaning of power curves
Despite these reservations, it is inescapable that the aerodynamic power required for an animal to fly follows a U-shaped curve with speed, with the greatest power at extreme low and high speeds. Induced power required for hovering or very slow flight must be higher than for forward flight because of the greater volume of air that must be transported past the wings in order to support the weight. Parasite and profile powers must rise to high values in fast forward flight because of the increasing frictional drag owing to the passage of the body and wings through the air. A bird may manipulate the power curve by behavioural or morphological strategies, but the physical constraints of supporting the weight and providing thrust to balance drag cannot be circumvented, and it is these which determine the shape of the power curves. Against this must be set the possibility that physiological processes in the conversion of fuel to aerodynamic work are indirectly dependent on speed, and that the total power curve may therefore have a very different shape. The experiments on starlings summarized here indicate that efficiency rises with speed so that the trough of the metabolic power curve is flatter, and the rising portion of the curve is less steep. There is no reason to assume that the same should happen in every bird species.
However, the frequency of measured power curves with relatively shallow rise in power at speeds indicates that this shape is real, and is relatively common. At very high speeds the curve must rise, because an increase in friction is inescapable. It is possible that this portion of the curve is not achieved by many birds because of other constraints. Hypothetically, a fast-flying bird may be unable to maintain high levels of thrust simultaneously with supporting the weight (Rayner 1993). It is usually assumed (following Pennycuick 1969) that the upper limit to flight speed is set by power available from the flight muscles. This assumption has never been tested, and is contradicted by observations of ‘flatter’ power curves. One consequence of the flatter curve could be that the maximum range speed is inaccessible. This may have substantial implications for predictions of behavioural models of flight strategies.
The major challenge facing investigators of avian flight energetics is now to understand in more detail the physiological processes that mediate the performance of aerodynamic work, and to establish how they are related to aerodynamic factors such as wingbeat kinematics. It is the total metabolic power that determines the energy demand on the bird in flight, and it is against this background that avian life histories have evolved. A bird will make behavioural decisions about foraging and flying based on the metabolic power curve. It is likely that certain behavioural strategies in flight themselves distort the power curves. Three separate mechanisms can be identified by which this might occur. First, as mentioned above, flight in ground effect and intermittent flight strategies both modify the mean rate of performing aerodynamic work compared to steady and level free flight. Second, a bird must control wingbeat kinematics (e.g. frequency, amplitude, upstroke flexure, etc. (Rayner 1993)) to fly at different speeds. This is one of the mechanisms by which a bird gears the power output of the flight muscles to the aerodynamic power required for flight. As kinematics change, the stress, strain and strain rate developed in the flight muscles also change, and as different muscle fibres are used or fibres are used in different ways a bird is likely to experience varying flight muscle efficiency. The starling experiments indicate that variation in efficiency with speed could be appreciable. Third, many birds cannot vary kinematics–and therefore thrust and power output—continuously over a range of speeds; instead they change gait by changing the aerodynamic function of the upstroke at a characteristic speed (Rayner 1986, 1993, 1995; Tobalske & Dial 1996). In an analogous situation, terrestrial tetrapod mammals do not have a single power curve, but separate U-shaped curves of energy per unit distance for each of the three gaits, walk, trot and canter (Hoyt & Taylor 1981). It is tempting to speculate that something similar happens in birds as they change gait. Theoretical models indicate that this is likely to be the case (Rayner 1993, Alexander 1997), but measured power curves appear not to have the sensitivity to show this effect.
The principle that birds adjust either or both of wingbeat kinematics or flight behaviour to control speed, and that flight muscle efficiency varies concomitantly, leads to a further hypothesis which may be of considerable significance for interpretation of behavioural strategies in flight. We cannot be certain that for every species of bird the whole range of speeds could be available. This could be expressed in ranges of speed at which efficiency is low or total power is unduly high. It could be driven by other behavioural or mechanical constraints, just as comparable factors determine gait selection in running mammals. Some speeds may correspond to kinematic patterns which are inconsistent with the anatomy of the wings and pectoral girdle, which cannot generate sufficient lift or thrust, or which correspond to excessively low flight muscle efficiencies. Such mechanisms are undoubtedly responsible for constraints on flight speed, and are implicated in the gait change in longer-winged birds (Rayner 1993). The result is that a bird’s perception of the power-speed curve may differ substantially from the smooth curves obtained from models. In the extreme—and at present hypothetical—case the power curve may simply not exist, but may be fragmented as mechanical, physiological and other factors (for instance such as sensory perception, prey behaviour or predator evasion) constrain a bird to a narrow choice of flight speeds for which its flight system is well adapted, and which are consistent with its life style and its use of its environment. Although it seems optimal for evolution to select bird designs that are flexible and are not constrained in this way, it is possible to envisage circumstances in which a species has become adapted for highly specialised and mechanically stereotyped behaviours. Presumably this is not the case for species that have demonstrated the ability to fly comfortably at a wide range of speeds in a wind tunnel. The hypothesis that this is the case for all species has not formally been tested. Further exploration of this hypothesis needs better understanding of the potential for the mechanical and thermal properties of the flight muscles and wingbeat kinematic patterns to impose direct or indirect constraints on flight speed selection.
ACKNOWLEDGEMENTS
We are grateful for the collaboration with Udo Möller, Dieter Bilo, Werner Nachtigall and John Speakman in performing the starling study summarized here; this research was funded by BBSRC grant J36150 to JMVR and John Speakman. JMVR’s work on flapping flight aerodynamics is also funded by the BBSRC.
REFERENCES
Ahlborn, F. 1896. Zur Mechanik des Vogelfluges. Abhandlungen der Naturwissenschaftlicher Verein Hamburg 14: 1–134.
Alexander, R. McN. 1997. The U, J and L of bird flight. Nature, London 390: 13.
Archer, R.D., Sapuppo, J. & Betteridge, D.S. 1979. Propulsion characteristics of flapping wings. Aeronautical Journal 83: 355–371.
Betteridge, D.S. & Archer, R.D. 1974. A study of the mechanics of flapping wings. Aeronautical Quarterly 25: 129–142.
Bishop, C.M. & Butler, P.J. 1995. Physiological modeling of oxygen consumption in birds during flight. Journal of Experimental Biology 198: 2153–2163.
Bishop, C.M. 1997. Heart mass and the maximum cardiac output of birds and mammals: implications for estimating the maximum aerobic power input of flying animals. Philosophical Transactions of the Royal Society of London B 352: 447–456.
Chai, P. & Dudley, R. 1995. Limits to vertebrate locomotor energetics suggested by hummingbirds hovering in heliox. Nature, London 377: 722–724.
Cone, C.D. 1968. The aerodynamics of flapping bird flight. Special Scientific Report of the Virginia Institute of Marine Science 52.
De Labouret, Ch.-M. 1889. Calcul des forces mises en jeu dans le vol des oiseaux. In: Marey, E.J. Le Vol des Oiseaux. Paris: G. Masson, 1890: 339–382.
DeLaurier, J.D. 1993. An aerodynamic model for flapping-wing flight. Aeronautical Journal 97: 125–130.
Dial, K.P, Biewener, A.A, Tobalske, B.W & Warrick, D.R. 1997. Mechanical power output of bird flight. Nature, London 390: 67–70.
Ellington, C. P. 1991. Limitations on animal flight performance. Journal of Experimental Biology 160: 71–91.
Fullerton, J. D. 1925. The flight of birds. Journal of The Royal Aeronautical Society 29: 535–543 & 595–597.
Gnosspelius, O.F. 1925. Notes [to J. D. Fullerton ‘The flight of birds’]. Journal of The Royal Aeronautical Society 29: 543–547 & 648–649.
Greenewalt, C.H. 1975. The flight of birds. Transactions of the American Philosophical Society 65, part 4.
Hedenström, A. 1995. Ecology of avian flight. PhD thesis, University of Lund, Sweden.
Hedenström, A. & Alerstam, T. 1995. Optimal flight speed of birds. Philosophical Transactions of the Royal Society of London B 348: 471–487.
Houston, A. I. 1992. Optimization of locomotion. In: Mechanics of animal locomotion, R. McN. Alexander (Ed.). Advances in Comparative Environmental Physiology 11. Berlin: Springer Verlag: 277–300.
Hoyt, D.F. & Taylor, C.R. 1981. Gait and the energetics of locomotion in horses. Nature, London 292: 239–240.
Jenkins, F.A., Dial, K.P. & Goslow, G.E. 1988. A cineradiographic analysis of bird flight: the wishbone in starlings is a spring. Science 241: 1495–1498.
Kvist, A., Hedenström, A., Klaassen, M. & Lindström, Å. 1988. Minimum power speed determined from mass loss in birds flying in a windtunnel. In: Adams, N.J. & Slotow, R.H. (eds) Proc.22 Int. Ornithol. Congr., Durban.
Lilienthal, O. 1889. Der Vogelflug als Grundlage der Fliegekunst. Berlin: R. Gaertner and München: Oldenbourg. [Various edns. Annotated first edn reprinted Wiesbaden: Sändig, 1977; trans. Birdflight as the basis of aviation. London: Longmans Green, 1911; St. Petersburg, 1905, etc.]
Marey, E.J. 1890. Physiologie du mouvement. Le vol des oiseaux. Paris: G. Masson.
Masman, D. & Klaasen, M. 1987. Energy expenditure during free flight in trained and free-living Eurasian kestrels (Falco tinnunculus). Auk 104: 603–616.
Pennycuick, C.J. 1968. Power requirements for horizontal flight in the pigeon Columba livia. Journal of Experimental Biology 49: 527–555.
Pennycuick, C.J. 1969. The mechanics of bird migration. Ibis 111: 525–556
Pennycuick, C.J. 1975. Mechanics of flight. In: Avian biology, D. S. Farner. D.S. & J. R. King, J.R. (eds), vol. 5. London: Academic Press: 1–75.
Pennycuick, C.J. 1989. Bird flight performance: a practical calculation manual. Oxford University Press.
Pennycuick, C.J. 1995. The use and misuse of mathematical flight models. Israel Journal of Zoology 41: 307–319.
Pennycuick, C.J., Klaasen, M., Kvist, A. & Lindström, Å. 1996. Wingbeat frequency and the body drag anomaly: wind-tunnel observations on a thrush nightingale (Luscinia luscinia) and a teal (Anas crecca). Journal of Experimental Biology 199: 2757–2765.
Phlips, P.J., East, R.A. & Pratt, N.H. 1981. An unsteady lifting line theory of flapping wings with application to the forward flight of birds. Journal of Fluid Mechanics 112: 97–125.
Poore, S.O, Sanchez-Haiman, A. & Goslow, G.E. 1997. Wing upstroke and the evolution of flapping flight. Nature, London 387: 799–802.
Prandtl, L. 1918. Tragflügeltheorie. Nachrichten der königlichen Gesellschaft der Wissenschaften zu Göttingen Mathematische-physikalische Klasse, 107–451.
Prandtl, L. & Tietjens, O.G. 1934 Applied hydro- and aerodynamics. London, Constable. Reprinted Dover Publications, New York.
Rayner, J.M.V. 1979a A vortex theory of animal flight. Part 2. The forward flight of birds. Journal of Fluid Mechanics 91: 731–763.
Rayner, J.M.V. 1979b. A new approach to animal flight mechanics. Journal of Experimental Biology 80: 17–54.
Rayner, J.M.V. 1985a. Flight, speeds of. In: Campbell, B. & Lack, E. (eds). A dictionary of birds. Calton: T. & A. D. Poyser: 224–226.
Rayner, J.M.V. 1985b. Bounding and undulating flight in birds. Journal of Theoretical Biology 117: 47–77.
Rayner, J.M.V. 1986. Vertebrate flapping flight mechanics and aerodynamics, and the evolution of flight in bats. In: Nachtigall, W. (ed.) Biona Report 5, Bat flight – Fledermausflug, W. Stuttgart: Gustav Fischer Verlag: 27–74.
Rayner, J.M.V. 1990. The mechanics of flight and bird migration performance. In: Bird migration, E. Gwinner (Ed.). Heidelberg: Springer Verlag: 283–299.
Rayner, J. M.V. 1991. On the aerodynamics of animal flight in ground effect. Philosophical Transactions of the Royal Society of London B 334: 119–128.
Rayner, J.M.V. 1993. On aerodynamics and the energetics of vertebrate flapping flight. In: Fluid dynamics in biology, A. Y. Cheer & C. P. van Dam (Eds). Contemporary Mathematics 141. Providence: American Mathematical Society: 351–400.
Rayner, J.M.V. 1994a. Aerodynamic corrections for the flight of birds and bats in wind tunnels. Journal of Zoology 234: 537–563.
Rayner, J.M.V. 1994b. Avian flight energetics in relation to flight speed and body size: discrepancies between theory and measurement. Journal für Ornithologie 135: 302.
Rayner, J.M.V. 1995a. Dynamics of the vortex wakes of swimming and flying vertebrates. In: Biological Fluid Dynamics, C. P. Ellington & T. J. Pedley (Eds). Symposium of the Society for Experimental Biology 49: 131–155.
Rayner, J.M.V. 1995b. Flight mechanics and constraints on flight performance. Israel Journal of Zoology 41: 321–342.
Rothe, H.-J., Biesel, W. & Nachtigall, W. 1987 Pigeon flight in a wind tunnel. II. Gas exchange and power requirements. Journal of comparative Physiology B 157: 99–109.
Thomas, A.L.R. 1996. The flight of birds that have wings and a tail: variable geometry expands the envelope of flight performance. Journal of Theoretical Biology 183: 237–245.
Tobalske, B.W. & Dial, K.P. 1996. Flight kinematics of black-billed magpies and pigeons over a wide range of speeds. Journal of Experimental Biology 199: 263–280.
Torre-Bueno, J.R. & LaRochelle, J. 1978. The metabolic cost of flight in unrestrained birds. Journal of Experimental Biology 75: 223–229.
Tucker, V.A. 1973. Bird metabolism during flight: evaluation of a theory. Journal of Experimental Biology 58: 689–709.
Tucker, V.A. 1974. Energetics of natural avian flight. In: Paynter, R.A. (ed.) Avian Energetics. Nuttall Orn. Club: 298–334.
Tucker, V.A. 1975. Flight energetics. Symposium of the Zoological Society of London 35: 49–63.
von Holst, E. & Küchemann, D. 1941. Biologische und aerodynamische Probleme des Tierfluges. Naturwissenschaften 29: 348–362. [Trans. Biological and aerodynamical problems of animal flight. Journal of The Royal Aeronautical Society 46: 39–56, 1942. (abridged) and NASA Technical Memoranda 75337: 1980.]
von Mises, R. 1945. Theory of flight. New York: McGraw-Hill [reprinted New York: Dover, 1959.].
Walker, G.T. 1925 The flapping flight of birds. I. Journal of The Royal Aeronautical Society 29: 590–594.
Walker, G.T. 1927. The flapping flight of birds. II. Journal of The Royal Aeronautical Society 31: 337–342.
Ward, S., Möller, U., Jackson, D.M., Rayner, J.M.V., Nachtigall, W. & Speakman, J.R. 1998. Measurement of the power requirement for flight by digital thermography. In: Adams, N.J. & Slotow, R.H. (Eds) Proc.22 Int. Ornithol. Congr., Durban. Ostrich 69: 236.
Ward, S., Möller, U., Rayner, J.M.V., Jackson, D.M., Nachtigall, W. & Speakman, J.R. 1999a Power requirement for starling flight in a wind tunnel. Biology and Conservation of Fauna (in press).
Ward, S., Möller, U., Rayner, J.M.V., Jackson, D.M., Bilo, D., Nachtigall, W. & Speakman, J.R. 1999b. Power consumption and whole animal efficiency during flapping flight in the European starling. (In preparation)
Ward, S., Rayner, J.M. V., Möller, U., Jackson, D.M., Nachtigall, W. & Speakman, J.R. 1999c. Heat transfer from starlings Sturnus vulgaris during flight. Journal of Experimental Biology (in press).
Weber, T.P. & Houston, A.I. 1997. Flight costs, flight range and the stopover ecology of migrating birds. Journal of Animal Ecology 66: 297–306.
Welham, C.V.J. 1994. Flight speeds of migrating birds: a test of maximum range speed predictions from three aerodynamic equations. Behavioural Ecology 5: 1–8.
Westerterp, K.R. & Drent, R.H. 1984. Flight energetics of the starling (Sturnus vulgaris) during the parental period. Proc. 18th Int. Orn. Congr., Moscow., pp. 395–398.
Wieselsberger, C. 1914. Beitrag zur Erklärung des Winkelfluges einiger Zugvögel. Zeitschrift für Flugtechik und Motorluftschifffahrt 5: 225–229.
Winter, W. 1895. Der Vogelflug: Erklädrung der wichtigsten Flugarten der Vögel mit Einschluss des Segelns und Kreisens. München: Theodor Ackermann.
Fig. 1. Partitioning of the energy flows from a flying bird, as used in modelling flight performance (modified from Rayner 1995b). It is argued in the text that this partitioning of physiological energy flows, in particular of basal and postural powers, is not realistic. Aerodynamic work represents at most 20% of total power output, and can be modelled as outlined in Appendix 1. Internal metabolic energy and postural costs are small, but are possibly comparable to aerodynamic work in total; there is no formal justification for this partitioning of the physiological components of energy output. The largest component of energy lost by the bird in flight is heat released by muscular contraction, which is convected and radiated from the body, wings and legs and is dissipated by transpiration (Ward et al. 1998c).
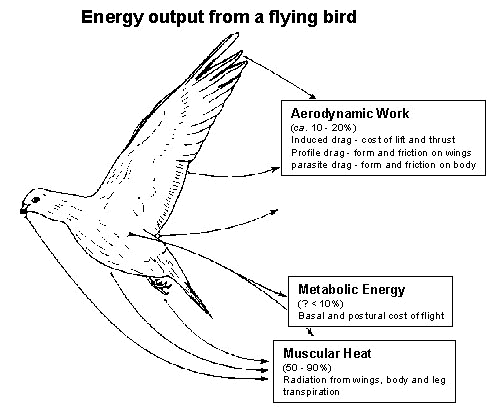
Fig. 2. A typical power curve for a low-speed aircraft, computed by lifting line theory (from von Mises 1945). This formulation is based on the action of the wings in generating trailing vortices, and is the basis of the understanding of low-speed aircraft aerodynamics, and, as explained in the text, of flapping bird flight. One component of power, the induced power, declines as the reciprocal of speed; another, the drag of the body and wings, increases as the cube of speed, and as a result the total aerodynamic power curve is U-shaped. Similar curves apply to helicopters, except that profile power includes the drag of the rotating rotors, and does not decline to zero at low speeds. [The figure has been relettered for legibility.]
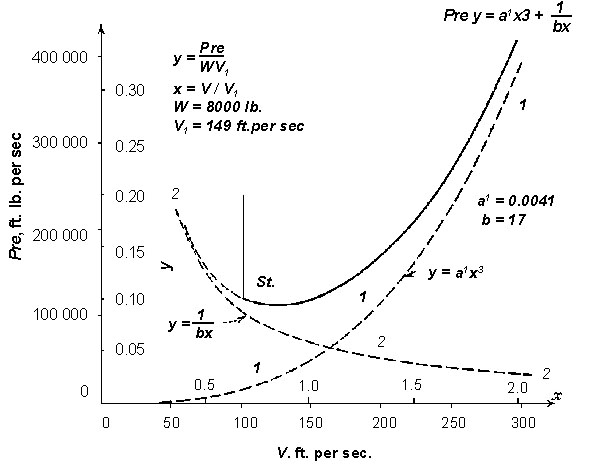
Fig. 3. The first power curves for flying birds (Gnosspelius 1925) to be published were obtained by fixed-wing lifting-line theory, based on contemporary aircraft practice. The values plotted are expressed in the archaic units of ‘lbs weight of bird per HP developed’ (sic.), which is proportional to the inverse of mechanical power per unit mass [specific power (W/kg) » 167/y-axis-value; the power estimates are probably somewhat low]. The power curves are clearly U-shaped, but are shown here with an emphasis on higher speeds than would be realistic for birds in level flapping flight. [The figure has been relettered for legibility.]
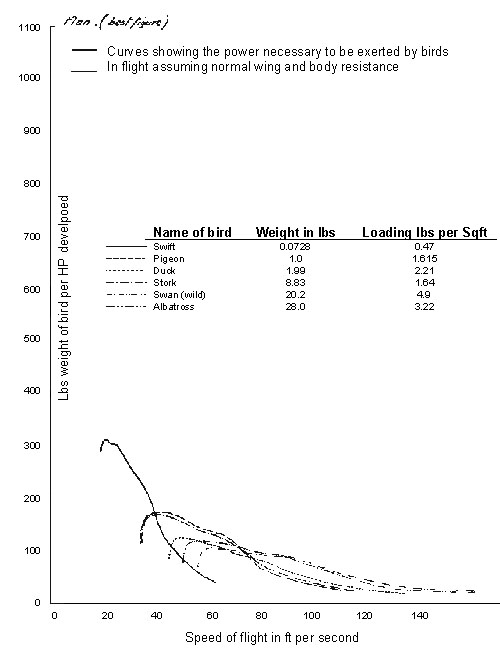
Fig. 4. Mechanical power curves computed for a typical bird (the Eurasian Kestrel Falco tinnunculus) by the continuous vortex model of Rayner (1986, 1993). This is a fully unsteady implementation of lifting line theory, incorporating realistic descriptions of wingbeat kinematics and wake structure. The dashed curves show for comparison the power for an equivalent fixed wing aircraft of the same design: the differences between these lines and the corresponding continuous curve show the cost of generating thrust by flapping the wings (from Rayner 1995b).
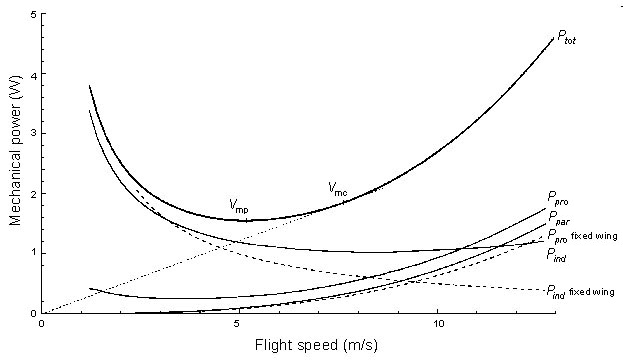
Fig. 5. Metabolic power curves measured for birds and bats flying in wind tunnels, shown (A) as absolute measurements and (B) relative to predicted performance at minimum power flight speed. This scaling is an approximate method of eliminating the effects of size. (From Rayner (1994), where details of sources were given.)
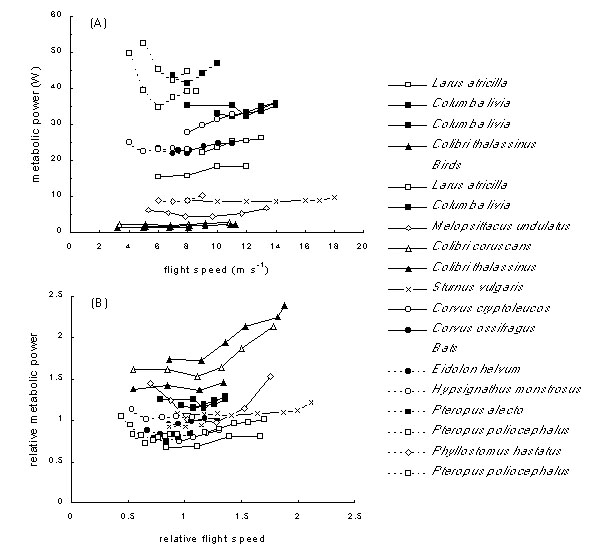
Fig. 6. Starling power curves and whole body efficiency, modified from Ward et al. (1998b). (A) Metabolic power for European starlings measured by gas exchange. Birds 1 & 2: Ward et al., Universität des Saarlandes, 1998, with respiratory mask; TBL: measurements of slightly lighter birds by Torre-Bueno & Larochelle (1978), shown for comparison. (B) Whole animal efficiency in flight determined with mechanical power computed for two European starlings by two different aerodynamic methods, allowing for variation in air density and for drag and weight of respiratory mask, and with vortex ring model with measured wingbeat kinematics (Ward et al. 1998b). The shaded bar shows the range of whole animal efficiency (0.18–0.19) which would be equivalent to a flight muscle efficiency of 0.23: this greatly exceeds the majority of measured values.
Appendix 1: Formulation of power models
(a) Mechanical power consumption in flapping flight
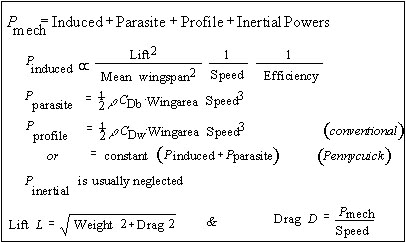
Notes:
1. r is air density. CDw and CDb are drag coefficients of body and wings, respectively.
2. Efficiency, mean wingspan and wing drag coefficient CDw all depend on wingbeat kinematics and may depend critically on flight speed. In flapping flight induced power cannot decline as 1/speed because of the increasing cost of thrust.
3. For fixed wing aircraft, lift is identical to weight (independent of drag) at all speeds.
4. Usually Drag is ignored in estimating lift. At low speeds this approximation is unjustified: the dashed curve shows the effect on total power of incorporating this term.
5. This model is usually referred to as the ‘lifting line’ theory, from the derivation of induced power from the energy cost of generating wake vortices.
(b) Metabolic power consumption in flight
Metabolic power output is computed from the estimated mechanical component by adding postural and basal metabolism.
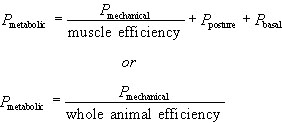
Postural and basal metabolisms represent artificial partitions of ‘internal’ energy consumption, and are probably not realistic. No models exist which might permit estimation of these quantities against speed in flying birds. Muscle efficiency is usually assumed to be around 25%, but there is limited experimental evidence for this value, and it is probably appreciably lower in smaller birds.
Metabolic power output is normally assumed to be identical to the energy equivalent of oxygen uptake (often referred to mistakenly as ‘power input’) during steady state aerobic flight.