S19.4: Ecology, life history and sexual selection in Forest Grouse (Tetraoninae): A phylogenetic perspective
Jacob Höglund
Dept. Zoology, Uppsala University, Villavägen 9, SE-752 36, Uppsala, Sweden, fax 46 18 559888, e-mail jacob.hoglund@zoologi.uu.se
Höglund J. 1999. Ecology, Life history and sexual selection in Forest Grouse (Tetraoninae): A phylogenetic perspective. In: Adams, N.J. & Slotow, R.H. (eds) Proc. 22 Int. Ornithol. Congr., Durban: 1126-1140. Johannesburg: BirdLife South Africa.The focus of this study is characters that may be a result of sexual selection in forest grouse (Tetraoninae). I have tested whether there is an association between high levels of polygyny and sexual dimorphism as predicted by theory. I found tentative support for high levels of polygyny being correlated with higher levels of sexual size dimorphism and sexual dichromatism using a phylogenetic approach. Ecological characters from a subset of the 18 species within the clade were traced on a phylogenetic tree obtained from mt-DNA sequence data. All characters contained some phylogenetic information and some characters showed high degrees of phylogenetic consistency indicating a strong phylogenetic component in their evolution. Examples of such characters are in what type of habitat structure and what forest succession stage the species live. The results imply that most characters are suitable for phylogenetic analyses and that polygyny level is associated sexual dichromatism and size dimorphism in this group. In the case of size dimorphism, sexual selection for larger body size in males may be the ultimate cause for larger dimorphism in species subjected to intense sexual selection.
INTRODUCTION
There are in principle two ways in which species can be similar (Eggleton & Vane-Wright 1994). One is that they are similar because they share a common ancestor. Characters might therefore be evolutionary homologies. Since all life on earth probably has one origin all species are of course more or less related. However, species that are more closely related exhibit more homology than species that are more distantly related. The other reason for why species might be similar is that, even though they are not closely related, they have similar ecologies and they face, or have faced, similar selective pressures. This is referred to as convergent evolution. By comparing species, general conclusions about how ecological circumstances shape adaptations can be inferred. This research tradition has a long history that dates back before Darwin (Brooks & McLennan 1991; Harvey & Pagel 1991). On the other hand, the distribution of character states among taxa form the basis for the systematic classification of species. By tradition and necessity ecologists have therefore been more interested in convergence and systematists have focused on homology (Coddington 1994). This difference has lead to partly different views on how comparative studies should be performed. During the last few years a common view has begun to emerge where both convergence and homology are taken in to account (Brooks & McLennan 1995).
The forest grouse (Tetraoninae) is a monophyletic group having evolved from a common pheasant-like ancestor. This group of birds, which inhabit the Nearctic and Palearctic, consists of 18 species which vary in a number of parameters such as social organisation, life-history and feeding ecology (Hjorth 1970; Potapov 1985). In some species males defend quite large territories that contain resources necessary for female reproduction. Such species exhibit a varying degree of polygamy (resource defence polygamy). Other species have smaller territories and males collect on so-called leks. Such species are strongly polygamous and the mating system imposes strong sexual selection on the males. Although estimates of the variance in male reproductive success in lekking and non-lekking species within the clade are still scarce, especially for the non-lekking species, it seems as if lekking species experience greater variance than non-lekking. For example, in lekking black grouse Tetrao tetrix the range in annual male mating success can be as large as 0-25 females (Höglund et al. 1990). In contrast, the range in mating success for the non-lekking ptarmigan Lagopus mutus is 0-2 (Brodsky 1988).
The principal aim of this paper was to investigate whether a given social organisation has lead to specific adaptations in relation to sexual selection. Sexual selection theory (reviewed by Andersson 1994) predicts that species with a mating system that is signified by a high variance in male mating success (i.e. leks) will show higher degrees of sexual dimorphism as compared to species with lower levels of variance in male mating success. This prediction was tested using a phylogenetic approach. Furthermore, an analysis of homoplasy (possession by two or more species of a similar or identical trait that has not been derived by both species from their common ancestor; Futuyma 1986) for a range of ecological, life-history, behavioural and morphological characters in the forest grouse was conducted. The aim of this part of the paper is to validate the use of ecological and behavioural characters in phylogenetic analyses.
METHODS
Character states
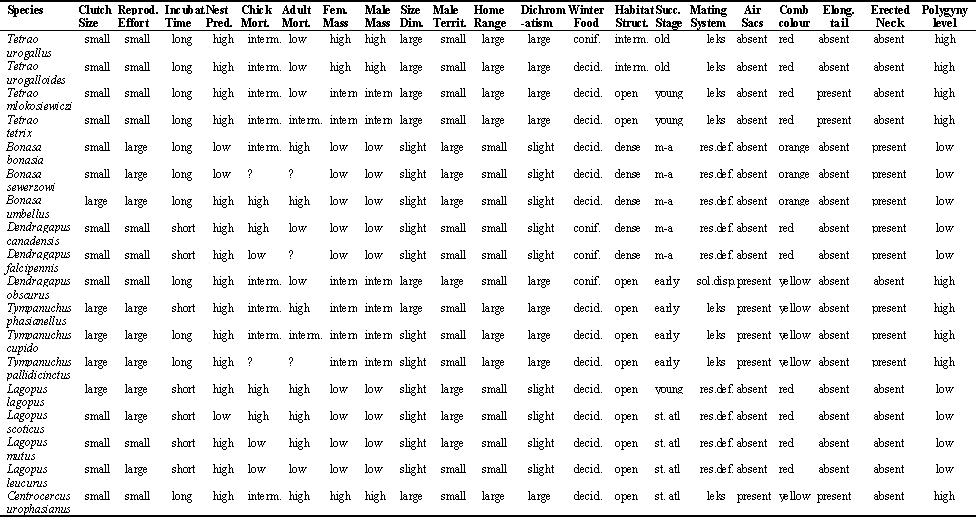
From the literature I extracted information on life-history characters (clutch size, reproductive effort, incubation time, nest predation and adult mortality), morphological characters (female and male body mass, sexual size dimorphism, sexual dichromatism and presence of ornaments) and ecological characters (male territory size, female home range size, winter food, habitat structure, forest successional stage when applicable and mating system). I used the published information in Hjorth 1970, Cramp 1980, Johnsgard, 1983, Brodie 1985, Potapov 1985, Jönsson et al. 1991 and Dunning 1992 (Appendix 1).
Character Reconstructions
The phylogenetic hypothesis used is based 1563 bp sequences from parts of 4 mitochondrial (mt-DNA) genes (cytochrome b, ND2, 12S rRNA and 16S rRNA; J. Höglund, S. Klaus, J. Swenson unpublished). The tree is completely resolved and parsimony and maximum likelihood methods give the same topology. Most branches have good to reasonable bootstrap/jack-knife support although some of the deeper branches within the in-group are still uncertain.
I used MacClade 3.0 (Maddison & Maddison 1992) for mapping the various characters on to the phylogenetic tree. For these reconstructions it was necessary to recode all continuous characters to discrete. All continuous characters were coded as binary characters where the cut-off was decided by inspecting the data and cutting the data in equal portions. Nine characters (sexual dichromatism, winter food, habitat structure, succession stage, mating system and the four ornament characters) were discrete to begin with and were not recoded.
I calculated the consistency index (CI, Kluge & Farris 1969) and the retention index (RI, Farris 1989) to obtain estimates of levels of homoplasy for the various characters following the logic in Wimberger and de Quieroz 1996, Irwin 1996 and Chan 1996. In short, the CI is the minimum number of steps required by a character assuming no homoplasy (convergence or reversals) divided by the number of steps required by the character on the tree. A CI of 1.0 indicates no homoplasy for the character in question whereas CI tends to 0 when homoplasy increases. Thus a character with high CI is one that rarely changes. The RI also compares the number of steps on the tree with the minimum number of steps. However, unlike CI, RI takes into account the maximum possible number of steps for the character given the number of taxa that have each state. The RI reflects the degree to which similarities apparent in the data can be retained as homologies (Farris 1989).
Correlated Evolution
To look for any possible association between mating system and sexual selection I used Purvis’ and Rambaut’s (1995) implementation (Comparative Analysis of Independent Contrasts; CAIC 2.0) of the independent contrast method (Felsenstein 1985; Pagel 1992). In these analyses I analysed a subset of the characters: female body weight (gr.), male body weight (gr.), male territory size (ha) which were all continuous and log transformed prior to analysis. Sexual size dimorphism was calculated following Lovich and Gibbons (1992) in which the sexual size dimorphism index (SSI) is defined as the mass of the larger sex divided by the mass of the smaller sex and multiplied by -1 if females are larger and +1 if males are larger. In the case of Tetraonid birds males but not females show variation in mating success and males are the larger sex. Polygyny level which is a discrete character was defined as 0=resource defence polygamy and 1=lek mating or solitary display. Male territory size was included as a continuous index of lekking (and thus the level of polygyny) because at leks males have small territories and in resource defence polygamy male territory size is larger (Höglund & Alatalo 1995).
I used the Crunch option in CAIC 2.0 when all variables were continuous and the Brunch option when one discrete character was analysed as the independent variable (in this case ‘polygyny level’). Branch lengths were obtained from the maximum likelihood tree generated from the molecular data using PAUP 4d64 (courtesy of D. Swofford).
I used the Concentrated Changes Test in MacClade 3.0 to calculate the probability of correlated evolution of ‘sexual size dimorphism, ‘sexual dichromatism’ and four aspects of ornamentation with ‘polygyny level’. Since several branches are equivocal in all the reconstructions I calculated the probability of all possible options (see Table 4).
RESULTS
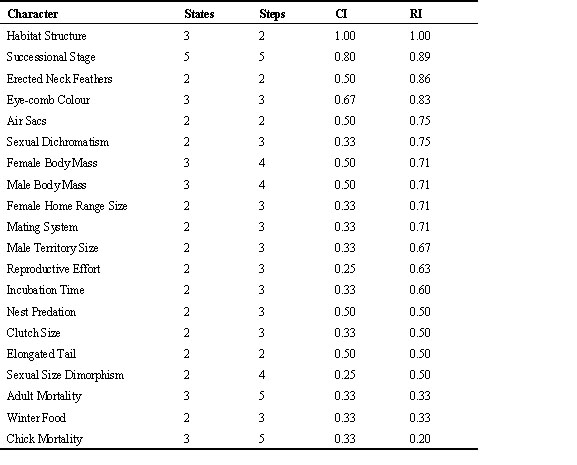
All characters analysed showed some phylogenetic information regardless whether they were life-history, morphological or ecological/behavioural characters (Table 1). I would like to point out that perhaps somewhat surprisingly the characters displaying the highest CI and RI indexes were of the ecological type: i.e. ‘habitat structure’ and ‘forest successional stage’.
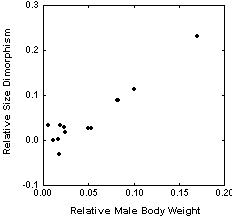
Using independent contrasts, sexual size dimorphism is correlated with both female weight (as an indicator of the size of the species from which the contrasts were obtained) and male body weight, but with not with male territory size (Table 2). Furthermore, I could find no significant relationship between male size and male territory size (Fig. 2, Table 2). When I used the Brunch option with the discrete character ‘polygyny level’ as the independent variable, I obtained three positive contrasts for sexual size dimorphism, female body weight and male body weight, meaning that a change in polygyny level from low to high has been accompanied with and increase for all the analysed dependent variables (Table 3).
The mapping of both sexual dichromatism and sexual size dimorphism on to the phylogeny revealed some evidence of a correlated evolution with polygyny level (Fig. 1, Table 4). Because all characters could not be mapped unambiguously on to the tree there is still uncertainty whether or not there is a statistically significant association between the mapped characters and polygyny level. However, for sexual size dimorphism and sexual dichromatism most of the mappings were indeed significant. When I mapped female body mass on to the tree (for this analysis the character was coded as a binary variable although in the analysis of homoplasy it had 3 states), I could find no significant association with polygyny level. None of the ornament characters showed any evidence of being correlated with polygyny level. Eye-combs was not included in Table 4 because all species posses such. Eye-comb showed variation in colour (yellow-orange-red) but the colour variation was not associated with polygyny level.
DISCUSSION
I have assumed that the intensity of sexual selection was correlated with my measure of polygyny level which is based on variation in mating system. Leks are generally accepted as the most extreme form of polygamy observed in nature (Darwin 1871, Andersson 1994, Höglund & Alatalo 1995). There is thus justification for assuming higher levels of polygyny in lekking species as compared to species that show resource defence polygamy. I have also included the Blue Grouse Dendragapus obscurus in the high polygyny category. Blue Grouse are reported to have a mating system signified by solitary display and there is little evidence of resource defence (Zwickel & Bendell 1972). Some populations have even been reported to collect in a semi-lek fashion (Lewis 1985).
High levels of polygyny should lead to a high intensity of sexual selection which in turn should lead to a correlation between sexual dimorphism and polygyny level across species. In this study some results seem to point in the predicted direction since higher levels of polygyny seemed to be associated with larger size differences between the sexes and males being more colourful than females. However, I failed to find any evidence that ornamentation was associated with high levels of polygyny. However, this lack of significance should not be taken as evidence of ornaments being unassociated with polygyny. The non-significant results should rather be considered in light of the few changes that has taken place in these characters. Elongated tails and air-sacs have both evolved twice in high polygyny groups which, albeit non-significantly, is what might be expected. This is in contrast to erected neck feathers and eye-combs which are displayed also by species that show low levels of polygyny.
The meaning of sexual dimorphism as used by Darwin and almost all subsequent authors is vague. The prediction is that males and females should be different in some way (morphologically, behaviourally or physiologically) as a result of sexual selection and that the sex subjected to the strongest selection should have responded by showing more exaggerated characters. However, there is no reason to believe that sexual selection will always favour larger males. In fact the claim that sexual selection sometimes favour smaller males, because of a higher aerial agility during sexual display flights, have been made repeatedly (Cade 1969; Andersson & Norberg 1981; Payne 1984). Likewise sexual selection may lead to sexual dichromatism but not universally. A logical conclusion of this argument is thus that even if a study fails to find evidence of sexual dimorphism in a particular character (say size or colour patterns) this could not be taken as evidence of sexual selection being unimportant or absent in the studied species. Sexual selection may indeed be operating but the target may be some other trait (e.g. vocalisations or other behaviours).
In this study, the evidence of sexual selection, as measured by variation in polygyny level, favouring larger or brighter males is tentative. Leks, and thus high levels of polygyny, have evolved on two or three occasions in the clade and the statistical association between polygyny and sexual dimorphism depend, for example, on if dimorphism evolved in the ancestor to the Sage Grouse Centrocercus urophasianus and the Tetrao clade and was then lost in the Ptarmigan Lagopus or if dimorphism evolved independently in Sage Grouse and Tetrao. Each reconstruction is equally parsimonious and, given that the topology of the tree is robust, this uncertainty can never be solved.
The contrast analyses revealed no clear association between sexual size dimorphism and mating system. However, it is doubtful whether the index of lekking used (i.e. male territory size) really conforms to the intensity of sexual selection which is the variable which should be used. Unfortunately there are not enough data to use the intensity of sexual selection as a continuous variable. The contrast analyses did show a strong association between sexual size dimorphism and both male and female body weight. This allometric relationship has been statistically controlled for in the other analyses conducted. Using polygyny level as a discrete character yielded 3 positive contrasts. This indicates that high levels of polygyny have become associated with a change to relatively larger males on three independent occasions but also by a change to larger overall body size in accordance with the patterns predicted. The significance of this relationship is obscure. One explanation may be that sexual dimorphism is a by-product of selection for larger males and/or females (see Cheverud et al. 1985). For example, if size dimorphism is caused by selection for larger males we ought to expect a larger difference as a species gets larger simply because females would be selected in the opposite direction as they are removed from their ecological optimum.
Perhaps the strongest evidence of sexual selection favouring dimorphism in this group of birds is that the Ptarmigan Lagopus may have lost dimorphism in both characters in association of a change from leks to resource polygamy. However, this interpretation depends heavily on the topology of the tree and the mapping of the character on to the tree. If the tree-topology changes as more molecular data is added the interpretation of this result could be changed. It should be noted that the poorest bootstrap support values (31, 18 and 52) in the phylogenetic hypothesis used (J. Höglund, S. Klaus and J. Swenson unpublished) are on the branches leading to Centrocercus, Tetrao and Lagopus, respectively.
A further potential criticism of the present work may be posed as follows: some of the characters used in this study might not be suitable for a phylogenetic analysis. It has previously been proposed (see references in Wimberger and de Quieroz 1996) that behavioural and ecological characters are signified by high levels of homoplasy, more so than morphological characters. The alleged reason for this is that behavioural and ecological characters are claimed to be under constant selection and should thus be expected to change rapidly and therefore follow no consistent phylogenetic pattern. My analysis of CI and RI indexes give little support for such a difference between morphology and ecological/behavioural characters. In fact the highest levels of phylogenetic consistency was found for two ecological characters (Habitat structure and Forest successional stage) and all characters show some phylogenetic information. This result echoes those of others (Wimberger and de Quieroz 1996; Irwin 1996; Chan 1996) which have shown that behavioural characters are no more homoplasious than morphological characters. Different kinds of characters are likely to evolve at different rates (Gittleman et al. 1996) but this is not the same as saying a priori that certain kinds of characters are not suitable for a phylogenetic analysis. Furthermore, because a character contains phylogenetic information this does not imply that a character is non-adaptive or that phylogeny is all that is needed to understand its evolution and maintenance.
In conclusion, the present analyses show tentative evidence of sexual selection driving the evolution of sexual dimorphism in the two studied characters within the clade. However, the patterns still remain obscure. Part of the reason for this obscurity can be ascribed to the difficulty in understanding the nature of sexual size dimorphism. As pointed out by Cheverud and co-workers (1985) selection can not act on a size difference per se. Rather, sexual size dimorphism emerges as a result of differential selection on size in the two sexes. The difference appears because the variance in fitness due to body size differs between the sexes and the genetic correlation between the sexes. I suggest that future studies should focus on whether or not there is a premium for large males in the species within the clade and if possible to quantify the advantage.
ACKNOWLEDGMENTS
I thank Phoebe Barnard and Marion Petrie for inviting me to the symposium on sexual selection and for giving me the opportunity to write this paper. Thanks also to Marion Petrie and Ian Jones for comments on the manuscript. This work was supported by the Swedish Natural Sciences Research Council.
REFERENCES
Andersson, M. 1994. Sexual selection. Princeton; Princeton Univ. Press: 559pp.
Andersson, M. & Norberg, Å. 1981. Evolution of reversed sexual size dimorphism and role partitioning among predatory birds, with size scaling of flight performance. Biol. J. Linn. Soc. 15: 105-130.
Brodie, I. 1985. Gamebirds of the northern hemisphere. Inverness; J.G. Eccles: 238pp.
Brodsky, L.M. 1988. Ornament size influences mating success in male rock ptarmigan. Anim. Behav. 36: 662-667.
Brooks, D.R. & McLennan, D.A. 1991. Phylogenetics, Ecology and Behavior: A Research Programme in Comparative Biology. Chicago; Univ. Chicago Press: 434pp.
Brooks, D.R. & McLennan, D.A. 1994. Historical ecology as a research programme: scope, limitations and the future. In Eggleton, P. & Vane-Wright, R. London; Academic Press; 1-28.
Cade, T.J. 1960. Ecology of the peregrine and gyrfalcon populations in Alaska. Univ. Calif. Publ. Zool. 63: 151-290.
Chan, L.K.W. 1996. Phylogenetic interpretations of primate socioecology: with special reference to social and ecological diversity in Macaca. In: Martins, E.P. Phylogenies and the comparative method in animal behavior. New York; Oxford Univ. Press: 324-233-360.
Cheverud, J.M., Dow, M.M. & Leutenegger, W. 1985. The quantitative assessment of phylogenetic constraints in comparative analyses: sexual size dimorphism in body weights among primates. Evolution 39: 1335-1351.
Coddington, J.A. 1994. The roles of homology and convergence in studies of adaptation. In Eggleton, P. & Vane-Wright, R. London; Academic Press; 53-78.
Cramp, S. (ed.) 1980. Handbook of the birds of Europe, the Middle East and North Africa. Vol. 2. Oxford; Oxford Univ. Press: 695pp.
Darwin, C. 1871. The descent of man and selection in relation to sex. London; J. Murray: 475pp.
Dunning, J.B. (ed.) 1992. CRC Handbook of avian body masses. Boca Raton; CRC Press: 371pp.
Eggleton, P. & Vane-Wright, R. (eds). 1994. Phylogenetics and Ecology. London; Academic Press: 376pp.
Farris, S.J. 1989. The retention index and homoplasy excess. Syst. Zool. 38: 406-407.
Felsenstein, J. 1985. Phylogenies and the comparative method. Am. Nat. 125: 1-15.
Futuyma, D.J. 1988. Evolutionary Biology. Sunderland, Mass; Sinauer Ass: 600pp.
Gittleman, J.L., Anderson, C.G., Kot, M. & Hang-Kwang, L. 1996. Phylogenetic lability and rates of evolution: a comparison of behavioral, morphological and life-history traits. In: Martins, E.P. Phylogenies and the comparative method in animal behavior. New York; Oxford Univ. Press: 166-205.
Harvey, P.H. & Pagel, M.D. 1991. The Comparative Method in Evolutionary Biology. Oxford; Oxford Univ. Press: 239pp.
Hjorth, I. 1970. Reproductive behaviour in Tetraonidae with special reference to males. Viltrevy 4: 184-596.
Höglund, J, Alatalo, R.V. & Lundberg, A. 1990. Copying the mate choice of others? Observations on female black grouse. Behaviour 114: 221-231.
Höglund, J. & Alatalo, R.V. 1995. Leks. Princeton; Princeton Univ. Press: 237pp.
Irwin, R. 1996. The phylogenetic content of avian courtship display and song evolution. In: Martins, E.P. Phylogenies and the comparative method in animal behavior. New York; Oxford Univ. Press: 234-252.
Johnsgard, P.A. 1983. The grouse of the world. London; Croom Helm: 410pp.
Jönsson, K.I., Angelstam, P.K. & Swenson, J.E. 1991. Patterns of life-history and habitat in Palearctic and Nearctic forest grouse. Ornis. Scand. 22: 275-281.
Kluge, A.G. & Farris, J.S. 1969. Quantitative phyletics and the evolution of anurans. Syst. Zool. 18: 1-32.
Lewis, R.A. 1985. Do blue grouse form leks? Auk 102: 180-184.
Lovich, J.E. & Gibbons, J.W. 1992. A review of techniques for quantifying sexual size dimorphism. Growth, Dev. & Aging 56: 269-281.
Maddison, W.P. & Maddison, D.R. 1992. MacClade Version 3. Sunderland; Sinauer Ass. Inc.:398pp.
Pagel, M. 1992. A method for the analysis of comparative data. J. theor. Biol. 156: 431-442.
Payne, R.B. 1984. Sexual selection, lek and arena behavior, and sexual size dimorphism in birds. Ornithol. Monogr. 33. Washington D.C.; American Ornthol. Union.
Potapov, R. 1985. Fauna USSR, Birds III. Leningrad; Izdatelstvo Nauka: 637pp.
Wimberger, P.H. & de Queiroz. 1996. Comparing behavioral and morphological characters as indicators of phylogeny. In: Martins, E.P. Phylogenies and the comparative method in animal behavior. New York; Oxford Univ. Press: 206-233.
Zwickel, F.C. & Bendell, J.F. 1972. Blue grouse, habitat, and populations. In Voous, K.H. (ed.). Proc 15th Int. Ornithol. Congr. Leiden; E.J. Brill: 150-169.
Table 1. Table showing the number of states, number of steps on the tree, the consistency index (CI) and the retention index (RI) for each character derived from parsimony analyses using MacClade 3.0.

Table 2. Results partial regression analyses of contrasts obtained using CAIC 2.0. Regressions were forced through the origin and dependent variables were log transformed before calculating contrasts.
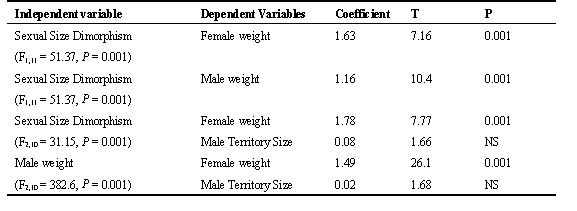
Table 3. Results of contrast analyses when the Brunch option in CAIC 2.0 was used (independent variable: polygyny level where 0 = low and 1 = high). For information on nodes see Fig. 1.

Table 4. Results of the concentrated changes test (Maddison & Maddison 1992) with ‘polygyny level’ as the independent character. The test calculates the probability (exact count in all cases) of a derived state of the response character falling on distinguished branches for the independent character (in this case those defined by the state ‘high’ polygyny level). Because the character states for polygyny level could not be derived unequivocally, the probabilities of assuming equivocal being both distinguished and not have been calculated. For the response variable all possible reconstructions with minimum cost have been provided.
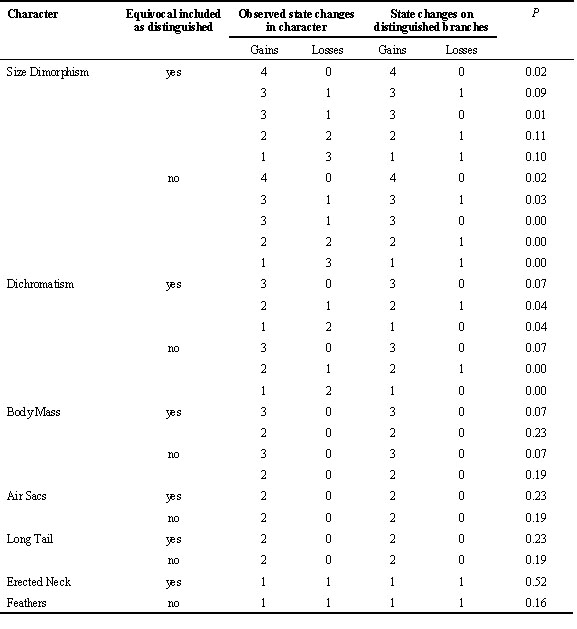
Fig. 1. The distribution of sexual dichromatism (a), sexual size dimorphism (b) and polygyny level (c) on a phylogenetic tree obtained from mt-DNA sequences (J. Höglund, S. Klaus & J. Swenson unpubl.).
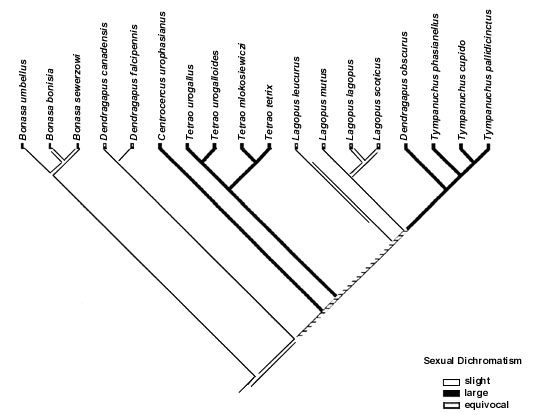
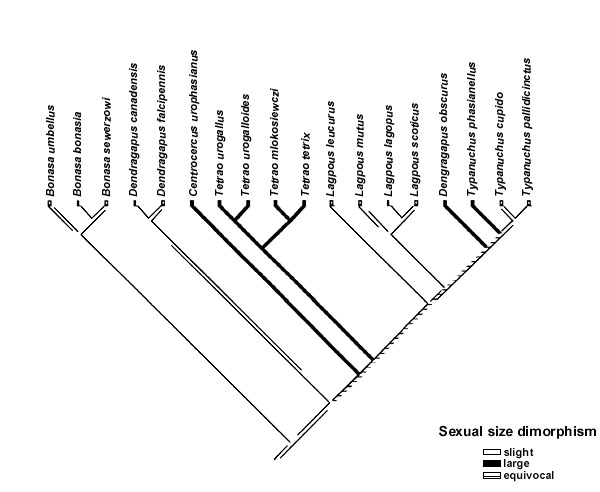
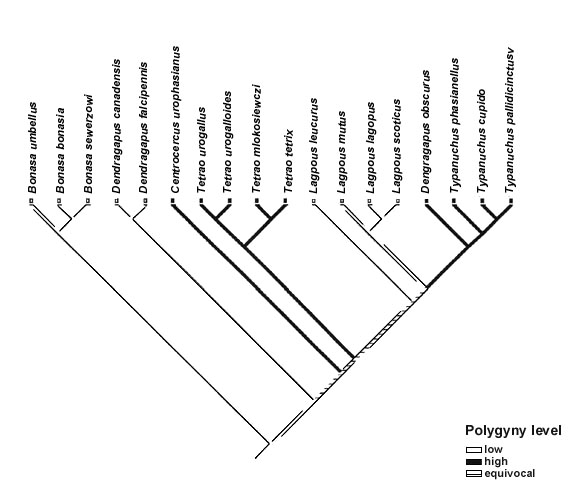
Fig. 2. Sexual size dimorphism versus male body weight. Each point represents a phylogenetically independent comparison (Felsenstein 1985).
Appendix. Character states for all characters in the study. Abbrevations: Reprod. Effort = reproductive effort; Incubat. Time = incubation time; Nest. Pred. = nest predation; Chick Mort. = chick mortality; Adult Mort. = adult mortality; Fem. Mass = female body mass; Male Mass. = male body mass; Size Dim. = sexual size dimorphism; Male Territ. = male territory size; Home Range = female home range size; Habitat Struct. = habitat structure; Succ. Stage = forest successional stage; Elong. Tail = elongated tail feathers; Erected Neck = erected neck feathers during display; ? = missing values; interm. = intermediate; conif. = coniferous, decid. = decidous; res.pol. = resource defence polygyny; st. atl = steppe or above the tree line; m-a = middle aged forest.
