S16.4: Individuality, exploration and foraging in hand raised juvenile Great Tits
Piet J. Drent & Chiara Marchetti
Netherlands Institute of Ecology, CTO, PO Box 40, NL 6666 ZG Heteren,The Netherlands, fax 31 26 4723227, e-mail drent@cto.nioo.knaw.nl
Drent, P.J. & Marchetti, C. 1999. Individuality, exploration and foraging in hand raised juvenile Great Tits. In: Adams, N.J. & Slotow, R.H. (eds) Proc. 22 Int. Ornithol. Congr., Durban: 896-914. Johannesburg: BirdLife South Africa.We analysed individual variation in exploration of an unfamiliar environment, reactions to a novel object in a familiar environment, the outcome in pair-wise encounters and foraging behaviour of hand-raised Great Tits Parus major. The results of the first two above-mentioned tests were combined into a score; the extremes of the distribution of these scores were labelled either ‘fast’ or ‘slow’ explorers. In pair-wise contests, ‘slow’ birds seldom start a fight, while 'fast' birds are more aggressive and normally win. We used the extremes to start a two directional selection for a ‘fast’ and a ‘slow’ line. During exploration of an unfamiliar environment, the young of the ‘slow’ line searched for food earlier and with a higher rate, therefore with a higher probability to find food. A test was performed to verify if individual differences in exploratory behaviour are also connected to the tendency to form routines in food-searching, Two groups of 7 males were selected among the ‘fast’ and ‘slow’ extremes. The birds were trained to search for covered food items in an array of different feeders, and later to concentrate their search on the feeders of one colour only. ‘Slow’ birds took longer to create the habit of concentrating on only one kind of feeder, since they went on exploring other possible feeders, but they responded quickly to changes in food distribution, enlarging their search to other types of feeders. ‘Fast’ birds create a habit quicker, by stopping to visit the no more rewarded feeders, and kept this habit longer even when food distribution was changed.
INTRODUCTION
Individual differences in behaviour are increasingly considered to be important in many groups of animals and have been found in humans and other vertebrates, independently of sex, age, or social status (see Wilson et al. 1994 for a review) The reactions of the individuals can be ranged along behavioural axes such as ‘shyness-boldness’ (see Wilson et al. 1994), ‘aggressiveness’ (Benus 1988) or ‘exploration’ (Clarck & Ehlinger 1987; Verbeek et al. 1994). Considerable differences among individuals have been found in the exploration of new environments and new objects, in fish, mice and Great tits (Clarck & Ehlinger 1987; Benus et al. 1987 ;Verbeek et al. 1994). The term ‘exploration’ is here used to indicate behaviour aimed at gathering information about a new situation, and thereby to become familiar with it. A ‘new situation’ can be either a completely new environment, or changes in the familiar one, including the introduction of unusual objects or changes in food placement. The change is expected to create a perturbation in the animal’s behaviour, followed by the resumption of the normal activities. In Great Tits, these differences in exploration were consistent during an individual's lifetime (Drent, unpubl.) and related to agonistic and social behaviour. Hand raised males that are ‘fast’ but superficial in exploring a new environment show a stronger tendency to approach new objects and to attack an opponent in pair-wise confrontations than birds that are ‘slow’; the latter seem to pay more attention to details of their environment (Verbeek et al. 1996). Very similar results were obtained for mice derived from strains two-directionally selected for aggressive behaviour, which were subsequently found to differ in exploratory behaviour (Benus et al. 1987; 1990). In both studies, the variation in behaviour was analysed comparing the more ‘extreme’ cases, which were more clear and identifiable and divided into ‘fast’ and ‘slow’ explorers (Verbeek et al. 1994), or according to the latency to attack an opponent (Benus et al. 1987; 1990). The first aim of this paper is to analyse whether the behavioural differences found in males also apply to hand raised females.
Searching for food is an aspect of exploration that is fundamental for survival, particularly the ability to find new food sources when the usual ones are depleted or the birds have dispersed to an unfamiliar environment. Different tendencies to form routines in food searching have been found in mice (Benus et al. 1990), with some individuals more conservative in their behaviour than others after a change in food distribution. The existence of differences in the way in which individual male birds perform routine behaviour in food searching was suggested by some preliminary experiments on Great Tits (Verbeek et al. 1994). After a change in food distribution, 'fast' explorers kept looking for food in the usual cup, whereas the 'slows' extended their search to other places much sooner. We studied the exploration of a new environment and the food searching behaviour of hand raised Great Tits, originating from two-way selection lines based on differences in exploration. The aim was to check if the behavioural differences in exploration also extend to searching for food. Moreover, we tested whether 'fast' and 'slow' birds differed in their tendency to form and to change a routine in foraging. The expectation was that habit formation rate should be higher in ‘fast’ explorers (see Verbeek et al. 1994) but that the ‘fast’ birds would take longer to modify their behaviour in response to a change in food distribution.
MATERIAL AND METHODS
The birds, their housing and food conditions
In 1993 and 1994, complete broods with in total 86 and 121 nestlings of Great Tits were collected from the wild at an age of ten days, and hand raised them as described in Verbeek et al. (1994). When these birds were 15 days old, they were sexed by the colour of the primary coverts. Their tarsus length was measured to the nearest 0.1 mm using callipers, and the body mass to the nearest 0.05 g using a mettler laboratory balance. At an age of 4 weeks, just before the first standard test started, the birds were weighed again.
After hand raising, at an age of 4 weeks, the birds were housed individually in standard cages of 0.9 x 0.4 x 0.5 m with three perches. Each cage was connected to an observation room via a sliding door of 20 x 20 cm in the rear wall. The birds were kept under natural light conditions, and had auditory and visual contact with other individually housed birds at a distance of about 2 m. They were provided with food and water ad libitum (see for details Verbeek et al. 1994). Two days after individual housing, the standard tests (see below) were started in order to compare exploration between males and females. After the standard tests and the pair-wise encounters, the birds were housed in flocks of 8 birds of the same sex in aviaries of 2 x 4 x 2.5 m. In the aviaries, the birds had several wooden trees and branches along the walls, and at least one roosting-site (nestbox) for each bird, two feeding trays and a drinking/bathing cup. The food was provided ad libitum and was the same as during the period in the living-cages.
The 86 hand raised juveniles in 1994 were used to start a two way selection to differences in exploration (Drent & Van Noordwijk 1997, in progress). The study to the relationship between differences in exploration and differences in searching for food, habit formation rate and changes in routines in foraging were carried by comparing young hand raised birds of the first and fourth generation of the two selection lines based on the extremes in the standard test below.
Standard tests
Exploration of an unfamiliar environment
This test was conducted in two closed observation rooms of 4.2 x 2.5 x 2.3 m. Each long wall had eight sliding doors connecting to the living cages. Observations were carried out through a one-way screen in one of the short walls. We led birds in and out of the room without handling, by darkening the cage and the room respectively. The observation room contained five artificial wooden trees 1.5 m high with four branches 20 cm long (see for details Verbeek et al. 1994). We observed the exploratory behaviour of each single individual during 10 minutes trials in the unfamiliar observation room one day after they were housed individually. We recorded the sequence of visits to the trees, the time of first arrival and the number of hops between the branches during one visit. When the individual had visited all the trees we stopped the observation, but all observations lasted at least two minutes.
Reactions to a novel object in a familiar environment
Ten days after the test in an unfamiliar environment, the birds were tested on differences in their reactions to a novel object in their living cage. We replaced one of the outer perches by a perch with a penlight battery attached to it. Two days later we repeated the experiment using a pink rubber toy (see for details Verbeek et al. 1994). The reactions of each bird were recorded from behind a screen for 2 minutes after the object was introduced. We measured the time needed to sit on the perch with the object (approach time) with a maximum of 2 min and the minimum distance to the object in that time period.
Pair-wise confrontations
In 1993 and 1994, when the birds were 10 weeks old, we selected the extremes on account of the sum of converted linear scales of both standard tests. Couples were formed each consisting of a ‘fast’ and a ‘slow’ explorer. The members of a pair were matched for hatching time, tarsus length, body mass and stage of moult (see Verbeek et al. 1996). Each bird was used only once.
The confrontations were conducted in a cage similar to the one in which they were housed. This cage was divided into two compartments of each 0.4 x 0.4 x 0.5 m by a wooden slide, with two perches in each compartment. An hour before the confrontation, a bird was put into each compartment. The confrontation started after the removal of the slide. We noted which bird started approach or agonistic behaviour, and the result of the interactions in terms of winner and loser. An interaction was won if one bird showed aggressive behaviour and the opponent reacted by fleeing or crouching. When one bird won 10 interactions more than his opponent, the confrontation was ended by reinserting the slide. Each confrontation lasted for at least 10 interactions an at most 15 minutes. In the latter case the winner was appointed afterwards if a bird won at least two third of the interactions.
In total, we tested 26 couples of males, 20 couples of females and 10 couples with a male and a female. In the latter case, 5 were with a ‘fast’ male and a ‘slow’ female, and the other 5 with a reversed composition.
Although earlier studies (see Drent 1983) had shown that normally males won, a pilot to study male/female confrontations was carried out, to see whether differences in exploration scores could influence the outcome. In all these ten cases, males always started the confrontation and became dominant, irrespective of their exploration scores. This indicates that sex overrules differences in exploration. Therefore, we concentrated on male-male and female-female contests.
Formation and change of routines
The birds and their housing
The choice of the individuals used in this study was based on the standard tests. In the autumn 1994, we chose 16 males from the first generation of the selection lines: 8 males with the shortest latency time ('fast'), and 8 males with the highest latency times ('slow'); during the training and the test one bird from each group was taken out of the analysis due to anomalous disturbing conditions. The choice of male birds only was made to increase comparability with previous studies (Verbeek et al. 1994); there is no basic difference between the sexes in the fast-slow dichotomy (this paper). The birds were housed in the individual cages connected with an observation room of 4.2 x 1.25 x 2.3 m by sliding doors for the duration of this experiment. In the living cages, they were fed in the standard way, except that mealworms were not provided. Pieces of mealworms, a preferred food, were used in the training sessions
Experimental setup
The birds were brought from the living cages to the observation rooms and back without handling, by darkening the room they had to leave. In each of the two observation rooms, four 'fast' and four 'slow' individuals were housed in the connecting cages.
The observation rooms contained two wooden ‘trees’ on which feeders were hooked. The trees were 1.7 m high and had four cylindrical branches perpendicular to each other. In contrast to earlier studies (Verbeek et al. 1994), we offered the birds a more structured environment, with a set of different feeders in which food could be hidden. Four kinds of feeders were used, consisting of plastic bowls of similar size, differing in colour and external shape only (Fig. 1). Each tree had 12 feeders, three of each type. Throughout the training and tests, the position of the feeders on the trees were randomly changed every day, so that memorising the position of specific feeders had no effect.
Training
In order to study the speed of developing habits, we trained the birds to find hidden food. Birds were deprived of food for 1-2 hours before each trial. Each training session lasted 15 minutes until 5th December, and 5 minutes from 7th December on. The training lasted from November 8th until December 8th 1994 and consisted of three different phases (Table 1).
In Phase A (5 days) a piece of mealworm was put in each feeder, totally uncovered: in this way birds became familiar with all the bowls as potential feeders. In Phase B (5 days) the food was still placed in each feeder, but covered with a layer of sand: birds had to learn to search for the food item by digging in the sand with their beak. In Phase C (12 days) there was still a layer of sand in all the feeders, but food was hidden only in the Green feeders. The birds had to learn to search for food only in this one feeder type, that is, they had to form a habit to feed in Green feeders.
The experiment: change in foraging routines
In the test, food was removed from all feeders, which thus only contained a layer of sand. The birds now had to react to a change in the usual situation, allowing us to observe the strength of their attachment to the Green feeders. The test was performed on 9 December and lasted 5 minutes for each bird. The choice of removing the food instead of just displacing it to other feeder types was made to avoid problems of reinforcement to the new feeder as a consequence of food finding.
Data recording
Observations were recorded on audio tape and later entered into the computer using an event recording program (‘The Observer’ Noldus Information Technology 1993). The visits to the feeders ('looking' and/or 'searching'), and actual feedings were recorded . The 'searching' behaviour is defined as actively digging in the sand, with the beak touching and removing it. In contrast, the 'looking' behaviour implies, as in Phase A, looking inside a feeder without having a direct contact beak-sand. Thus, during a visit, a bird may just look inside the feeders and then leave, or also spend some time searching inside it. Unless stated otherwise, all observations on the choice of the feeders are based on 'searching' behaviour only. Other kinds of behaviour were normally not recorded.
Searching for food during exploration of an unfamiliar environmentIn 1997 all hand raised juveniles of the two selection lines (F4) were tested in the standard way for differences in exploration of an unfamiliar environment, but now special attention was paid to when and how much the birds searched for food during the first two minutes (the minimum observation time). Searching for food was very typically indicated by a fast sequence of pecks on the stem and branches of the wooden trees and pecking in small holes, two in each branch. Similar behaviour was also regularly observed in the field.
Statistical analysis
We used non-parametric tests throughout (Siegel 1956). For the correlations we used the Spearman test, for comparisons between two independent samples we used the Mann-Whitney test, and for paired samples the Wilcoxon test. Frequency distributions were compared by a Chi-square test. Unless otherwise stated, all tests were two-sided.
RESULTS
Sex and differences in exploration
Exploration of an unfamiliar environment
Individuals of both sexes differed considerably in the time they needed to arrive on the fourth tree in both years. The latencies to visit the fourth tree (Fig. 2, combined data of both years for each sex) were not normally distributed, with relatively high numbers of birds that did not reach the fourth tree within the finite trial time. However, individuals with a long latency to visit or those that did not arrive to the fourth tree at all, hopped more frequently from branch to branch during a tree-visit than birds that had a short arrival time; these latter flew more directly from tree to tree without much hopping (Spearman correlation between arrival time and hopping: Males: rs ranging from 0.64 to 0.74, females rs = 0.59 - 0.78, all P < 0.01). The latency to visit the fourth tree was never correlated with tarsus length and body-mass at day 15 after hatching and just before the test ( all P > 0.5).
The frequency distribution of arrival times
did not differ between the sexes (Fig. 2, data of both years
combined: ![]() = 6.31, P = 0.79, n.s.).
= 6.31, P = 0.79, n.s.).
Reactions to a novel objects in a familiar environment
In both years and in both sexes, most birds
approach the penlight battery either very soon or not at all in the finite trial time (Fig. 3, combined data of both years for males and females). Similar
results were found for the latency to approach a pink rubber toy: the individual reactions
to both novel objects were correlated (rs ranging from 0.54 - 0.90, all P
< 0.01), indicating consistency in reactions to different novel objects. In all
cohorts, latency to approach both objects was strongly correlated with the minimum
distance to the object in the trial time (rs = 0.71 to 0.99, all P<
0.01): birds that approach an object quickly also approach it more closely. In both years
and both sexes the latency to approach the objects and the distance to them were never
correlated with tarsus length and body mass (all P > 0.5). The frequency
distribution of the latencies to approach was not different between the sexes (Fig. 3, data of both years combined : ![]() = 7.66, P = 0.81, n.s.). In
both years and in both sexes, the latency to visit the fourth tree and the latency to
approach new objects were positively correlated (rs ranging from 0.46-0.94, all
P < 0.05): birds that approached a novel object faster also quickly visited all
trees in an unfamiliar environment. There were no differences between the sexes also in
this respect.
= 7.66, P = 0.81, n.s.). In
both years and in both sexes, the latency to visit the fourth tree and the latency to
approach new objects were positively correlated (rs ranging from 0.46-0.94, all
P < 0.05): birds that approached a novel object faster also quickly visited all
trees in an unfamiliar environment. There were no differences between the sexes also in
this respect.
Sex , differences in exploration and dominance in pair wise confrontations
In all 26 contests between males, fights were
started and dominance/subordination could be determined. In 85% of the male-male contests,
the ‘fast’ male started the confrontation, and in 81% of the cases a
‘fast’ male was the final winner (Fig. 4, ![]() =
5.44, P = 0.02), confirming earlier results by Verbeek et al. (1996). In
females, in two of the contests no aggressive behaviour was observed during the trial
time; in the other 18 contests, ‘fast’ females started the confrontations in 77%
of the cases, not differently from the male-male contests. In other two among these
remaining 18 female-female contest, no winner could be appointed. In case of contests with
clear outcome (n= 16) ‘fast’ females won in 88% (Fig. 4;
=
5.44, P = 0.02), confirming earlier results by Verbeek et al. (1996). In
females, in two of the contests no aggressive behaviour was observed during the trial
time; in the other 18 contests, ‘fast’ females started the confrontations in 77%
of the cases, not differently from the male-male contests. In other two among these
remaining 18 female-female contest, no winner could be appointed. In case of contests with
clear outcome (n= 16) ‘fast’ females won in 88% (Fig. 4; ![]() =
5.24, P = 0.02).
=
5.24, P = 0.02).
The outcomes, in terms of fast and slow
winners, were not different between the sexes (![]() = 2.18, P = 0.14). However,
male-male contests were much more vehement than female-female contests, with marked
differences in the amount of skirmishes and aggressive level (Drent, in progress).
= 2.18, P = 0.14). However,
male-male contests were much more vehement than female-female contests, with marked
differences in the amount of skirmishes and aggressive level (Drent, in progress).
Formation and changes of routines
Consistency of the classification
In the first training day, birds were introduced singly into the observation room, when they were about 6 months of age. The latency to shift from the first tree on which they landed to the other one was significantly lower in ‘fast’ (mean = 100.38 sec, S.D. = 53.56) than in ‘slow’ individuals (mean = 373.86 sec, S.D. = 83.92. One-sided Mann-Whitney test: Z = -2.66, P = 0.004,). This measurement is similar to the ‘time taken to arrive to the 5th tree’, tested by Verbeek et al.(1994) with similar results: the classification of the birds into ‘fast’ and ‘slow’ individuals is therefore supported by the comparison with previous results. The time that the birds spent looking into the feeders was instead lower in the ‘fast’ (mean = 58.00 sec, S.D.=11.51) than in the ‘slow’ individuals (mean = 106.00 sec, S.D. = 21.02). For the comparison, the total time spent looking has been expressed as a proportion of the ‘total time available for looking’, that is, only after the birds had actually started to explore the feeders, and compared between the two groups (‘fast’: mean = 0.071, S.D.= 0.10; ‘slow’: mean = 0.132, S.D.= 0.19; z = -2.32, P = 0.02). The number of visits to the feeders is not significantly different but tends to be higher in the ‘slow’ individuals (mean = 25.17, s.d.= 4.96) than in the ‘fast’ (mean = 16.62, s.d.= 3.21. Z = -1.68, P = 0.09). These results support the suggestion made by Verbeek et al. (1994) that there is a difference in the ‘thoroughness’ of exploring an environment.
Consistency within individuals and searching rate
Each individual showed a consistent behaviour throughout the training. The correlations between the amount of searching of each individual on different days of the training are all positive and 12 out of 15 were significant (P < 0.05, Spearman rank correlation). The median number of searching visits for each bird over 6 training days is positively correlated with its mean number of feeds on the same days (n = 16, rs = 0.91, P<.001). The individuals that searched more intensively were therefore able to find more food.
Choice of feeders and habit formation
For the analysis of the birds' choice we considered the searching visits to the different feeders. To make a clear contrast between the visits to the Green feeders, where the birds are taught to feed in the third phase of the training, and to the Other feeders, that no longer contain food in that same phase, we pooled the visits to the Other feeders. In this way we could follow the change of behaviour of the birds in relation to the Other, non-green, feeders, as shown in Fig. 5. In phases A and B, all the feeders contained food, and thus we expected no preference in the visits, that is an expectation of 25 - 75% visits to Green versus Other feeders, while in phase C this expectation changed to 100% visits to Green feeders, the only ones containing food.
Phase A and B : Food in all feeders. On day
A1 (food uncovered), B1 and B5 (food covered by sand) the median percentage of visits to
the other, non- green feeders was not different from an expectation 75-25% ( A1: ![]() =0.15 for the
‘fast’ and 0.08 for the ‘slow’; B1 and B5:
=0.15 for the
‘fast’ and 0.08 for the ‘slow’; B1 and B5: ![]() = 0.48, for the ‘fast’ in
both days and 0.053 and 0.013 for the ‘slow’, all P > 0.10). There was
no difference between ‘fast’ and ‘slow’ birds in the median percentage
of visits to the other, non-green feeders ( Mann-Whitney test, P >0.10 in the
three days).
= 0.48, for the ‘fast’ in
both days and 0.053 and 0.013 for the ‘slow’, all P > 0.10). There was
no difference between ‘fast’ and ‘slow’ birds in the median percentage
of visits to the other, non-green feeders ( Mann-Whitney test, P >0.10 in the
three days).
Phase C: Food only in Green feeders, covered. In Phase C, food was restricted to the Green feeders only. The speed with which the birds ceased to visit the non-rewarded other feeders, was in fact different in the two groups (Fig. 5), as shown by a pair-wise comparison between successive days. On the first day of phase C (C1), ‘fast’ birds significantly decreased the visits to the other, non-green feeders, while ‘slow’ birds did not change if compared with the last day (B5) of the previous phase (one-sided Wilcoxon paired tests. 'fast': z = -2.20, P = 0.01; 'slow': z = -0.34, P > 0.10). On the second day (C2), both groups significantly‘ decreased their visits to the other feeders ('fast': z = -2.02, P = 0.02; 'slow': z = -2.02, P = 0.02). On the third day C3, there was no more a significant decrease in either group ('fast': z = -1.21, P > 0.10; 'slow': z = -1.22, P > 0.10). From day C3 to day C12, the last day of phase C, there was no difference in the visits to the other feeders in the ‘fast’ birds while there was still a significant decrease in the ‘slows’ ('fast': z = -0.36, P > 0.10; 'slow': z = -1.83, P = 0.03). This means that the process of decreasing the visits to the non-rewarded feeders takes longer in the ‘slow’ birds than in the ‘fast’.
The difference between the two groups in the percentage of visits to the other feeders is not significant on day C1, C3 and C12, but is significant on day C2, where ‘slow’ birds search more in the other feeders (One sided Mann-Whitney test: Day C1: z = -1.48, P = 0.07. Day C2: z = -1.69, P = 0.04. Day C3: z = -0.69, P > 0.10. Day C12: z = -0.69, P > 0.10).
In conclusion, although all birds eventually concentrate their search on the Green rewarded feeders, neglecting the Others, ‘slow’ individuals take more time in this process because they go on inspecting the Other feeders even well after they stop to be rewarded.
Removal of food and habit change
At the end of phase C, the birds were tested without food for 5 minutes.
During the test, 'slow' birds searched in the other feeders more than the 'fast' (One-sided Mann-Whitney test; z=-1.90, P = 0.02, Fig. 5). Comparing with the previous day (Day C.12), 'slow' birds significantly increased their searching in the other feeders, while 'fast' did not change (One-sided Wilcoxon paired test; 'Fast': z = 0.40, P > 0.10; 'slow': z = 2.52, P = 0.005,
In conclusion, when ‘slow’ birds do not find food where they expect it, they readily extend their search to other possible sites within 5 minutes. In contrast, ‘fast’ birds do not change their choice to the different feeders. This confirms the previous results, that ‘fast’ birds tend to maintain a routine behaviour longer than ‘slows’.
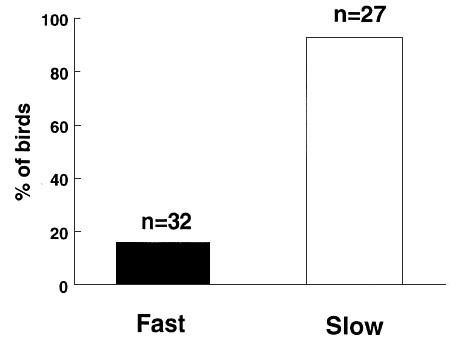
Exploration and searching for food in an unfamiliar environment
The latency to reach the fourth tree was
markedly different between the ‘fast’ and ‘slow’ lines (Fig. 6, ![]() = 56.24, P < 0.001), with hardly any overlap.
All young from the ‘fast’ line reached the fourth tree within 4 minutes, while
the young of the ‘slow’ line took more time and often did not reach the fourth
tree within the 10 minutes of the trial. Again, there were no differences between the
sexes (P > 0.7). Although individuals differed markedly in the number of
movements (combined jumps between trees and hops between branches of the same tree),
ranging from 2 to 20 during the first two minutes of the test, the frequency distribution
did not differ between young of the ‘fast’ and ‘slow’ line (Fig. 7A,
= 56.24, P < 0.001), with hardly any overlap.
All young from the ‘fast’ line reached the fourth tree within 4 minutes, while
the young of the ‘slow’ line took more time and often did not reach the fourth
tree within the 10 minutes of the trial. Again, there were no differences between the
sexes (P > 0.7). Although individuals differed markedly in the number of
movements (combined jumps between trees and hops between branches of the same tree),
ranging from 2 to 20 during the first two minutes of the test, the frequency distribution
did not differ between young of the ‘fast’ and ‘slow’ line (Fig. 7A, ![]() = 2.86, P > 0.58, n.s.). However, when we
analysed how they moved, the frequency distribution of the percentage of hops over total
movements strongly differed between the two lines (Fig.7B,
= 2.86, P > 0.58, n.s.). However, when we
analysed how they moved, the frequency distribution of the percentage of hops over total
movements strongly differed between the two lines (Fig.7B, ![]() = 42.94, P
< 0.001). ‘Fast’ birds normally flew between trees, visiting the whole
environment, while ‘slow’ birds slowly enlarged their area of activities hopping
between the branches within a tree. In contrast to the ‘fast’ birds, most
‘slow ‘ birds searched for food already in the first 2 minutes, by pecking on
branches and looking and exploring the corner between stem and branches and the small
holes in the branches (Fig. 8,
= 42.94, P
< 0.001). ‘Fast’ birds normally flew between trees, visiting the whole
environment, while ‘slow’ birds slowly enlarged their area of activities hopping
between the branches within a tree. In contrast to the ‘fast’ birds, most
‘slow ‘ birds searched for food already in the first 2 minutes, by pecking on
branches and looking and exploring the corner between stem and branches and the small
holes in the branches (Fig. 8, ![]() = 34.71, P < 0.001).
= 34.71, P < 0.001).
‘Slow’ birds searched earlier and more frequently than ‘fast’ birds, considering the time elapsed after the first search (mean number of searches per minute observation time: ‘fast’ : n =10, 0.60 ± S.E. = 0.15; ‘slow’ : n = 26, 1.14 ± S.E. = 0.11. Mann-Whitney test, S = 249, P < 0.05).
DISCUSSION
Differences in exploration
Verbeek et al. (1994) found that some juvenile male great tits quickly visited all trees in an unfamiliar environment, paying short visits and hopping little from branch to branch during a visit. Other males explored the environment more slowly by gradually enlarging the area used, staying longer on each tree by hopping from branch to branch. These differences extended to the reaction to novel objects in a familiar environment (differences in neophobia). The ‘fast and superficial’ explorers approach different novel objects consistently quicker and more closely than ‘slow and cautious’ explorers. Our results in both the standard tests and the experiment on habit formation confirm these conclusions and demonstrate that they hold for both sexes.
Consistency in behavioural differences.
The individuals reacted in a consistent way to different novel objects in a familiar environment. The individuals kept their characteristic scores of ‘fast’ or ‘slow’ from the time of the standard test, at 4-6 weeks of age, to the start of training to habits in foraging, when they were already at least 6 months old. Other experiences they have had in the mean time, for instance in social groups before the training started, did not seem to have affected this feature.
The two-way directional selection, using the extremes of the combined score of arrival time on the fourth tree and the approach time to the novel object, showed a noticeable similarity between parents and their offspring and between siblings in a cross-fostering design, indicating a considerable degree of heritability in these differences ( Drent & van Noordwijk, in progress ). The two lines rapidly diverged during four generations, resulting in hardly any overlap of the frequency distributions (this paper, Fig. 6). The data of this fourth generation confirmed the suggestion given by Verbeek et al. (1994) that ‘slow’ birds were not simply slower or less active, but they behaved differently from ‘fast’ birds; the differences lie in the strategy used to collect and deal with information concerning the environment, including food distribution.
Differences in foraging activities
In an unfamiliar environment, ‘slow’ birds started searching for food earlier and more actively than ‘fast’. This will result in more food finding and eating, as shown during the training to a foraging habit. Moreover, each individual is highly consistent in its behaviour, as shown by the searching rate in different days during the training. The consistent tendency that emerges from the data on habit training is also supported by other observations (Verbeek, pers. comm.; Verbeek et al. 1994), and is worth verifying in future tests. In fact, it would be interesting to link individual differences with the food-searching strategies proposed by Barnard & Sibly (1981). In a flock of captive sparrows, some individuals were called 'producers', because they searched and found food more often, and others were called 'scroungers', because they tended to follow the first, either copying or snatching the food from them. The fact that some individuals seem to search more, and the correlation between searching and food finding suggests a similarity with the ‘producers’, but food-searching strategies should be analysed in detail in further studies.
Formation and changes of foraging routines
In the training, all birds tend to drop their activity very quickly in the absence of a reward, but the individuals differ in other behavioural activities. The process of habit formation is different in the two groups, with 'fast' birds readily restricting their search to the rewarded Green feeders and 'slow' birds taking more time to concentrate on them. The fact that 'slow' explorers take more time to create a routine does not mean that they are less able to perceive a change or to learn, because at the end of the training they are not different from the 'fast' group, and when in the test the food is taken away they are the quicker in responding. Thus they do not have different learning abilities, but they reach the same level through different paths. 'Slow' birds have a strong tendency to explore all the parts of the environment, with a low inclination to rigidly follow a habit which is part of a food searching strategy that lead the birds to sample the habitat. Individual differences in the amount of such ‘errors’ made during learning have often been reported in foraging experiments on captive tits (Krebs et al. 1977, Rechten et al. 1983), and they might be partially explained also by the presence of individuals with different searching strategies. The reaction to a change in the distribution of food, and therefore a change in the habit, showed opposite reactions of the two groups, with ‘slow’ birds very quick in changing habit and ‘fast’ modifying much less their behaviour in relation to the change. In a limited time, the difference between the two groups is quite clear, similarly to the tests of Verbeek et al. (1994); in our case, the design was more complex, with different feeder types whose relative position was changed every day.
An observation that could confirm a higher tendency of ‘fast’ birds to be routineous is that on the very first training day, some 'fast' birds visited the green feeders more than expected, differently from ‘slow’ birds. An explanation for this is that some of the test birds had already experienced the green feeders in the cages where they were previously housed, and were therefore familiar with them. In spite of this, at the start of the session, only ‘fast’ individuals had a tendency to visit the feeders they already knew more frequently, while ‘slow’ birds did not seem to be influenced by the previous experience and explored all the feeders more evenly. Again, during the first training phase birds of both groups eventually learned to search evenly in all the feeder types.
Differences in exploration and outcomes in pair-wise contests
Our results are in accord with those of Verbeek et al. (1996), where juvenile ‘fast and superficial’ males started fights earlier and behaved more aggressively in pair-wise contests than ‘ slow and thorough’ males, and thereby became more often the winners of the contests. Already at an early stage males were more aggressive than females (see also Drent 1983), so that males normally won from females, irrespective of their behavioural differences. Nevertheless in female-female contests the same results as for males also hold. This is not found in rodents (Benus et al. 1990), where often only males showed these differences in agonistic behaviour.
The relevance for coping styles
In summary, 'slow' individuals take more time to get acquainted with a new situation or new objects, and possibly they are more careful explorers, starting earlier and more intensely in food searching; they are much slower in forming habits, due to ‘errors’ that are a consequence of their attention to other possibilities in their environment, but are very quick in responding to changes in food distribution, enlarging their search to other sites. They have a very low tendency to start fights and are often losers in pair-wise confrontations. In pigs (Hessing et al. 1994) and rodents (Benus et al. 1990), individuals selected for their aggressive behaviour also showed differences in exploration and boldness: we found the same thing in Great Tits, although in our case the selection was based on exploration behaviour. These authors suggest the existence of different behavioural strategies, or ‘coping stiles’, to control challenges from the environment (see also Koolhaas et al. 1997), and we think that this may apply also to the Great Tits. ‘Active copers’, corresponding to the aggressive, ‘fast but superficial’ explorers, show the tendency to actively manipulate the situation that causes stress, whereas ‘passive copers’, the non-aggressive ‘slow but cautious’ explorers try to adjust to the situation.
The relevance for the natural situation
Since the relative differences among individuals are consistent over time and do not seem to be influenced by the environment or the history of the single birds, we might infer that they might be as consistent in free-living birds. Birds that are taken directly from the field and immediately tested often show clear tendencies towards one or the other kind of behaviour, although there are many intermediates (see also Verbeek et al. 1994; 1996). Of course, creating selection lines of ‘pure’ characters may lead to individuals that are possibly very different from what can be found in nature, but this is an important step to understand the extent of these differences and the underlying genetic mechanisms. We should not forget that the definition of ‘pure’ or ‘intermediate’ character is strictly dependent on the tests that we choose to define that character. A further step will be to study how these differences are manifested in nature, and how important and recognisable they are while observing the birds' behaviour in the field, for instance creating simple experimental situations at a feeding table. An experimental situation is necessary because, as we already stated, the differences emerge after a change in the environment, and may not be recognisable otherwise. A quick reaction in front of environmental changes or, in turn, a tendency to stick to routine foraging habits may prove equally valuable in front of different predictability of feeding sources. Since Great Tits form foraging flocks after fledging and in winter, the most critical periods for survival (Drent 1983; 1984), a mixed flock with both ‘fast’ and ‘slow’ individuals would prove successful. Differences in aggressive behaviour may also favour the aggregation of individuals with different foraging strategies (Barnard & Sibly 1981).
In conclusion, the individual differences in exploration previously found are also correlated with the development of social relationships, different food-searching patterns and tendencies to form routines. The behavioural differences found so far might have an ecological importance, because they determine the reaction of birds to new situations. This could lead to differences between ‘fast’ and ‘slow’ in the chance to survive, disperse and reproduce, but further more detailed field and laboratory studies will throw more light on these questions.
ACKNOWLEDGEMENTS
We wish to thank Anne Marie de Jong for her assistance during the observations, Monica Verbeek for useful discussions all along the work, Arie van Noordwijk for discussions, guidance in the statistical analysis and help on the manuscript. We are also grateful to Piet de Goede and Karin Kurk for having tested and selected the birds, and to Steven Visser for looking after them.
Kate Lessells, Vincent Bauchau and Francisco Pulido gave useful comments on the first drafts of the manuscript.
We gratefully acknowledge the financial support provided by the European Community under contract Nr. ERBCHRXCT930187.
This is publication 2509 of the Netherlands Institute of Ecology.
REFERENCES
Barnard, C.J. & Sibly R.M. 1981. Producers and scroungers: a general model and its application to captive flocks of House Sparrows. Anim.Behav. 29: 543-550.
Benus, R.F. 1988. Aggression and coping: differences in behavioural strategies between aggressive and non-aggressive male mice. Ph.D. Thesis, University of Groningen.
Benus, R.F, Koolhaas, J.M. & van Oortmerssen, G.A. 1987. Individual differences in behavioural reaction to a changing environment in mice and rats. Behaviour 100: 105-122.
Benus, R.F, Den Daas, S., Koolhaas, J.M. & van Oortmerssen, G.A. 1990. Routine formation and flexibility in social and non-social behaviour of aggressive and non-aggressive male mice. Behaviour 112: 176-193.
Clarck, A.B. & Ehlinger T.J. 1987. Pattern and adaptation in individual behavioural differences. In: Bateson P.P.G. & Klopfer P.H. (eds) Perspectives in Ethology, Vol.7: Alternatives: 1-47. Plenum Press, New York.
Drent, P.J. 1983. The functional ethology of territoriality in th great tit ( Parus major L.). Ph.D. thesis University of Groningen, Netherlands.
Drent. P.J. 1984. Mortality and dispersal in summer and its consequences for the density of great tits (Parus major) at the onset of autumn. Ardea 72: 127-162.
Drent, P.J. & Noordwijk, A.J. van 1997. Heritability of behavioural syndromes in the Great Tit. Advances in Ethology 32: 51
Hessing, M.J.C., Hagelso, A.M., van Beek, J.A.M., Wiepkema, P.R., & Schouten, W.P.G. (1994). Individual behavioural and physiological strategies in pigs. Physiol. Behav. 55: 39-46.
Koolhaas. J.M., Boer S.F. de & Bohus, B.1997. Motivational systems or motivational states: behavioural and physiological evidence. Appl. Anim. Behav. Sc. 53: 131-143.
Krebs, J.R., Erichsen, J.T.& Webber, M.I. 1977. Optimal prey selection in the Great Tit (Parus major). Anim.Behav. 25:30-38.
Noldus Information technology 1993. The Observer, Base Package for DOS. Reference Manual, Version 3.0 Edition. Wageningen, The Netherlands.
Rechten, C., Avery, M. & Stevens, A. 1983. Optimal prey selection: why do Great Tits show partial preferences? Anim.Behav. 31: 576-584.
Siegel, S. 1956. Non parametric statistics for the behavioural sciences. McGraw-Hill, New York.
Wilson, D.S., Clarck, A.B., Coleman, K. & Dearstyne, T. 1994. Shyness and boldness in humans and other animals. TREE 9 (11): 442-446.
Verbeek, M.E, Drent, P.J. & Wiepkema, P.R. 1994. Consistent individual differences in early exploratory behaviour of male Great Tits. Anim.Behav. 48: 1113-1121.
Verbeek, M.E, Boone, A. & Drent, P.J. 1996. Exploration, agonistic behaviour, and dominance in juvenile male Great tits. Behaviour: 133, 945-963.
Table 1. Scheme of the training and experimental days. Only the days that are analysed in the paper are indicated. Each day is indicated by a letter, referring to the phase of the training, and the number of the day within that phase. In Phase A and B we made 5 training sessions, in Phase C we made 12 sessions.
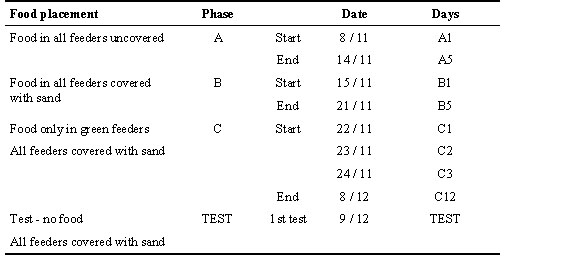
Fig. 1. The four feeder types used in the experiment. (1) Green: 6 x 4 x 3 cm. (2) White: diameter 5 cm x 3 cm height. (3) Yellow: 6 x 4 x 3 cm. (4) Brown: 6 x 7 x 3 cm.
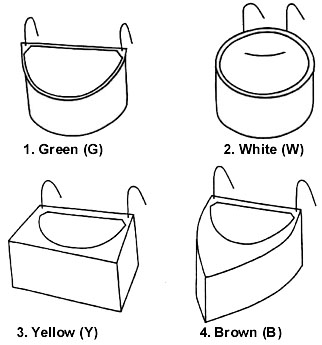
Fig. 2. Frequency
distribution of the latency to visit the fourth tree of males and females, separately, in
an unfamiliar environment. Data are grouped in classes of 1 minute; >10 min. indicates
birds failing to arrive within trial time. Difference between sexes: ![]() = 6.31, P = 0.79, n.s.
= 6.31, P = 0.79, n.s.
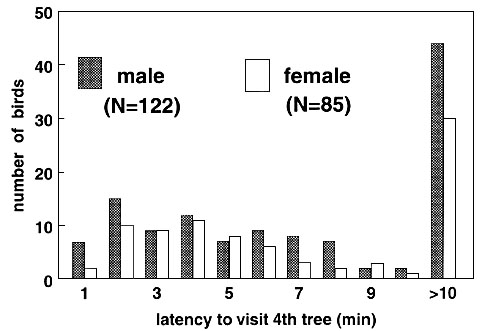
Fig. 3. Frequency
distribution of the latency to approach a novel object in a familiar environment of males
and females, separately,. Data are grouped in classes of 10 sec. >120 indicates birds
failing to approach within the trial time. Difference between sexes: ![]() = 7.66, P = 0.81, n.s.
= 7.66, P = 0.81, n.s.
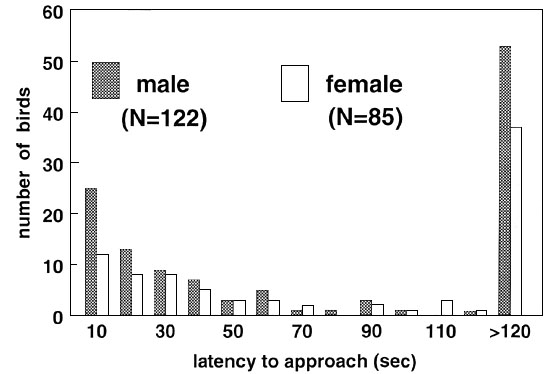
Fig. 4. The outcome of pair-wise confrontations,
each pair consisting of a ‘fast’ and a ‘slow’ explorer for males (A)
and females (B). The two distributions are not different (![]() = 3.39, P = 0.18), although in
females there are some fights without a clear winner.
= 3.39, P = 0.18), although in
females there are some fights without a clear winner.
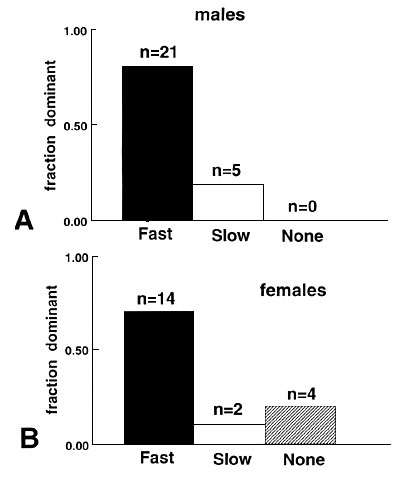
Fig. 5. Medians, with 1st and 3rd quartile, of the percentage of searching visits to the non-green feeders ('Others': White+Yellow+Brown). Dots: Training, in Phase B (all feeders covered and containing food) and Phase C (all feeders covered, but only Green containing food; see Table 1 for the training schedule. Squares: Test (all feeders covered, but without food). The values refer to the first 5 minutes of each observation. Filled symbols: 'Fast' birds; Open symbols: 'Slow' birds.
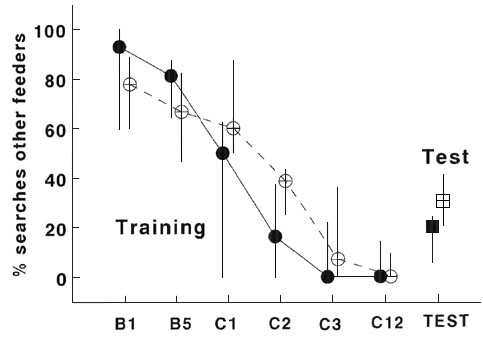
Fig. 6. Frequency distribution of the latency to visit the fourth tree in a unfamiliar environment of young of the fourth generation of a ‘fast ‘ and ‘slow’ selection line. Data are grouped in classes of 1 min. >10 min indicates birds that failed to arrive within trial time.
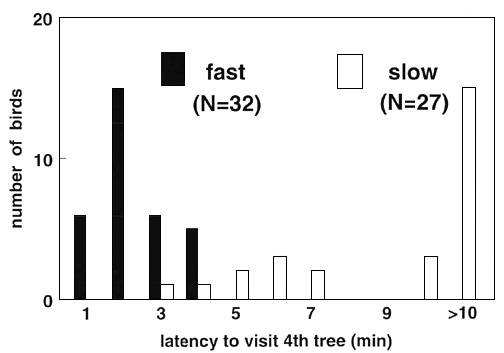
Fig. 7. (A) Frequency
distribution of total movements, i.e. flights between trees and hops between branches
within a tree, of young birds of the fourth generation of a ‘fast’ and a
‘slow’ selection line within two minutes after entering an unfamiliar
environment. Data are grouped in classes of 4. Difference between ‘fast’ and
‘slow’: ![]() = 2.86, P = 0.582, n.s. (B) Percentage of hops over the
total number of movements of the same birds. Data are grouped in classes of 20% hops.
= 2.86, P = 0.582, n.s. (B) Percentage of hops over the
total number of movements of the same birds. Data are grouped in classes of 20% hops. ![]() =42.94. P <
0.001.
=42.94. P <
0.001.
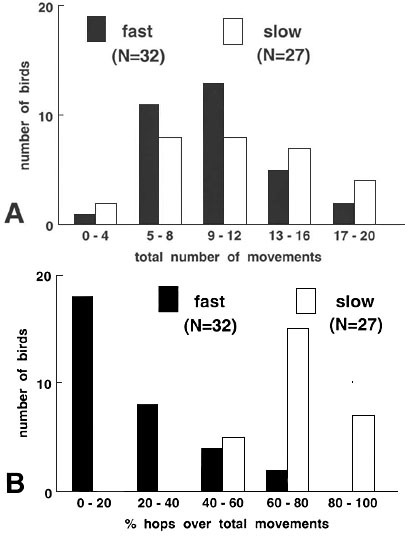
Fig. 8. Percentage of
individuals, among young birds of the fourth generation of a ‘fast’ and a
‘slow’ selection line, that start searching for food within two minutes after
introduction into an unfamiliar environment. Difference between ‘fast’ and
‘slow’: ![]() = 34.71, P < 0.001.
= 34.71, P < 0.001.