S07.1: Comparative energetics of passerine and non-passerine birds: Differences in maximal, potential productive and normal levels of existence metabolism and their ecological implication
Valery M. Gavrilov
Department of Vertebrate Zoology and General Ecology, and Zvenigorod Biological Station of Moscow State University, 119899 Moscow, Russia, e-mail Valery@VGavrilov.home.bio.msu.ru
Gavrilov, V.M. 1999. Comparative energetics of passerine and non-passerine birds: Differences in maximal, potential productive and normal levels of existence metabolism and their ecological implication. In: Adams, N.J. & Slotow, R.H. (eds) Proc. 22 Int. Ornithol. Congr., Durban:
338-369. Johannesburg: BirdLife South Africa.Basal metabolism, existence metabolism, maximal existence metabolism, potential productive energy and the maximum ability of birds to change their thermal conductance were measured by oxygen and food consumption in 26 species of passerine and 16 species of non-passerine birds. Seasonal changes of these energetic parameters have also been studied. An analysis of these parameters has been performed, dependent on the ambient temperature, and a bioenergetic model of the species has been developed. The character of maximal heat loss dependence on ambient temperature was determined. The relationship between basal metabolic rate and existence metabolism was established. Allometric analysis of abundant measured parameters allow observation or study of some aspects of bird energetics from an animal ecology view point. The level of maximum food energy or maximal existence metabolism is 1.3 times higher in passerines than in non-passerines, which is in good agreement with the ratio of their basal metabolic rates. The optimal ambient temperature for maximising productive processes (e.g. reproduction, moult) is lower for passerines than for non-passerines, which allows passerines to have higher production rates at moderate ambient temperatures. This may explain variation in bioenergetic parameters along latitudinal gradients, such as the well-known ecological rule of clutch size (or mass) increase in the more northerly passerine birds.
INTRODUCTION
This communication was designed to evaluate the interdependence of the components of the energy budget of birds. What is the significance of basal metabolic rate (BMR)? BMR is considered to be a measure of the minimum cost of organism maintenance, reflecting those basic physiological costs that are essential for life. The level of BMR among birds depends mainly on body mass, but after correcting for mass differences, there are still large differences among kinds of birds, especially between passerine birds and all other birds. In spite of the recent doubts about the significant difference in BMR between passerines and non-passerine birds (Reynolds and Lee 1996), numerous works demonstrate that Passerines have relatively high BMR; they also have high field metabolic rates, high existence metabolic rates, high maximum metabolic rates, and high rates of reproductive output during breeding. Does a high BMR determine high maximum power output, and hence high rates of energy expenditure for existence, growth and reproduction of a species or individual? Does BMR drive the entire energy budget? If BMR determines the other components of the energy budget, then all passerines should have high field metabolic rates, high reproductive output rates, high maximum metabolic rates (in cold stress tests), low lower critical temperatures, high existence metabolism, and high activity expenditures of energy, when compared to birds other than passerines. I examined these questions in a number of species having very different phylogenies, ecologies, diets, habitats, methods of locomotion and body size, first by comparing detailed energy budgets of passerine birds with non-passerines. Then, I evaluated the predictability and variability of allometric relationships for BMR and other energy budget components.
METHODS
More than 26 species of passerine birds representing the full size range of the order (from the Goldcrest, Regulus regulus, 5.5 g to the Raven, Corvus corax, 1208 g) and 16 species of non-passerine birds in a corresponding size range (25-4000 g) were chosen for analysis. Passerine and nonpasserine birds occurred in almost equal numbers, and species were distributed fairly evenly by latitude, although they were represented unevenly in the body mass continuum. Among the small birds, more species had distributions that tended toward southern regions than did the larger species, which had more northerly distributions. Because these uneven distributions were evident from the data for both passerine and non passerine birds, their comparison should not be affected. All the birds were kept in large aviaries at natural daylengths and temperatures. For migratory birds and subtropical species, the aviaries were heated in winter to maintain temperatures at 5-10o C. Measurement of energy values were made in winter (December, January) and summer (end of May, June) on non-moulting birds. Studies made on seasonal variations of energy expenditure, both at rest and at existence levels, were done at experimentally controlled temperatures, where TA was varied from +40o to -28o C, in order to construct a thermal energetic profile of each species studied. The system of energetic indicators (Kendeigh et al., 1977), including my recent modifications (Gavrilov, 1997), was used to estimate a bird's energetic balance.
The following levels of energy expenditure were measured: Basal metabolism (BMR) is the rate of energy utilisation by a bird at complete rest, without the costs of digestion and assimilation of food or cold stress, i.e. the rate of energy utilisation of fasting, inactive birds in the zone of thermal neutrality. Standard or resting metabolism (SMR) is the rate of energy utilisation of fasting, inactive birds when outside of the thermoneutral zone. SMR and BMR were measured by closed-circuit respirometry. Existence metabolism (EM) is the rate at which energy is used by caged birds maintaining a constant body mass (within 1-2% change) over a period of days when the birds are not undergoing reproduction, moulting, migratory unrest, growth, or fat deposition. The birds always had a surplus of food and water available. EM integrates BMR, temperature regulation, the heat increment of feeding and the energy expended in cage locomotor activity. It is determined by measuring the amount of food consumed (gross energy intake, GEI) and subtracting the amount of egested energy (faecal and urinary energy). The difference is the amount of energy metabolised (metabolised energy, ME). Maximal existence metabolism (MPE) is the maximum rate at which birds metabolise energy from food. MPE reflects the physiological capacity of the species, and relates to maximum sustained daily energy expenditures. MPE may be exhibited at a bird's lower limit of temperature tolerance (Tll). A bird can mobilise energy up to its MPE on a sustained basis to satisfy needs other than temperature maintenance, such as locomotor activity, reproduction and moult. The maximal existence metabolism does not, however, reflect the maximum capacity of body tissue for energy output, as MPE can be exceeded during short periods, even up to several days, as in prolonged flight. But then considerable time is required later to replenish the energy stock. The maximum intake of food energy was measured in 6 species under different experimental conditions: stimulation of metabolism by thyroxin injections (0.2 mg/bird per day during 5 days), estimation of the maximum feeding rate in moulting birds under temperature stress, in cold-stressed birds with their plumage cut off, and of the food consumption rate at an air temperature at which 50% of the animals died (LD50 method). All these methods give similar results to those obtained from the method of intercept points for regressions of EM and SMR upon TA. I assumed that at Tll the regression (equation) lines for SMR and EM on TA cross each other, i.e. EM=SMR=MPE at Tll. Thus, Tll may be calculated from the equations for SMR and EM. Because the values used in deriving the equations have been measured at very low TA (down to -28oC), the estimate of Tll should be accurate. In fact, in some species, Tll as determined by the equation crossover point method was the same as the ambient temperature at which 50% of the animals died (LD50 method). Thus, for some species, I used a combination of experimental data and calculations. For other species, I calculated Tll by assuming EM=SMR=MPE at this TA, and by using the equations for SMR and EM for those species. This procedure gives a way to estimate MPE in a large number of species (see Results).
Potential productive energy (PPE) is the amount of energy that a bird can mobilise over and above what it requires for existence(EM), as measured in caged birds. At its lower limit of temperature tolerance, all of the energy that a bird can assimilate is required for existence metabolism, and there is no surplus available for other purposes. At higher ambient temperatures, EM decreases and progressively more PPE becomes available, at least until the bird comes under heat stress. The determination of the amount of PPE available is important since it is a controlling factor in the initiation, peaking and ending of such events as reproduction, moulting and migration.
The ambient temperature at which the heat produced by BMR becomes sufficient to maintain the body temperature (TB) is called the low critical temperature (Tlc). Experimental data have shown that most homeothermic animals are capable of changing their heat loss and balancing the invariable BMR heat production. This feature of animals is explained by the arbitrary increase in thermal conductance by vasomotor reactions and by a change in the insulating properties of body cover, increase in water evaporation (without an increase in heat production), and the small amount of residual heat is dissipated by an adaptive increase in body temperature. The ambient temperature at which these three additional mechanisms are insufficient to balance the invariable BMR heat production is the upper critical temperature (Tuc). The ambient temperature interval between and Tuc and Tlc is the thermoneutral zone. The existence of the thermoneutral zone and the stability of BMR within it does not follow directly from physical laws but represents a specific feature of homeothermic animals. The existence of a thermoneutral zone is provided for by the presence of a circulatory system capable, via vasomotor reactions, of changing thermal conductance and heat-insulating body covers and their subsequent ability to alter thermal conductance. TB-Tlc is the critical temperature gradient. The critical temperature can be estimated as the ambient temperature at which the existence energy is equal to the potential energy. It is the lower limit of temperature tolerance (Tll). TB-Tll is the range of temperature where life is possible (including extreme points).
It is possible to determine the limiting influence of evaporative heat loss on the maximum metabolic rates of birds. The method of determining evaporative heat loss (He) from measurements of the rate of body mass loss at rest (dm) allows determination of percent of evaporative heat loss (%He) at different ambient temperatures. The loss of body mass at rest by a starved animal (assumed to be oxidising fat only) under constant conditions is due essentially to evaporation of water. Urine and faecal losses would be minimised by prior starvation, and the masses of oxygen consumed and carbon dioxide released approximately equal each other when fat is being oxidised. Nevertheless, use of this method involves direct and simultaneous measuring of the relationship (q) between heat production (as the rate of oxygen consumption) and body mass loss in moving air at constant relative humidity at various temperatures. Thus, any discrepancies in theoretical constants are subsumed in the measured q values. The rate of water evaporation determines the level of evaporative heat losses (He), and this is calculated easily from the relationship for the heat of vaporisation (2.43 kJ/g H2O). A definite correlation of the caloric equivalent and level of evaporative heat loss for any ambient temperature are found. But since there also is a specific level of heat production for any temperature, it is possible to calculate: 1) how much heat is dissipated through evaporation at any ambient temperature, and 2) how much water is spent to dissipate that amount of heat, because the evaporative heat of 1 gram of water is equal to 2.43 kJ.
The correlation of evaporative and non-evaporative heat loss was obtained as follows. Proceeding from q, I calculated %He for specific ambient temperatures from the following equations.
For purely fat metabolism:
%He=238.3q-0.98, where q=kJ/g or %He=2.76q-0.98, q=W/g
and allows calculation of %He for specific q values for purely fat metabolism (as I have done for winter measurements). Evaporative heat loss at any combination of oxidised compounds can be calculated by this method. I have taken a combination of oxidised substrata in studied species in Summer - fat, carbohydrate and protein - to be 0.7:0.1:0.2, respectively. The equation takes the form:
%He=239.3q-1.05, where q=kJ/g or %He=2.77q-1.05, q=W/g
Then He was calculated from the total level of heat loss at specific ambient temperatures (0oC for SMR, Tlc for BMR, Tuc for BMR): He=SMR %He/100 or He=BMR %He/100. The evaporative water loss (EWL, in g/day) was calculated from the following equation: EWL=He(kJ)/2.43. Deducting He from the total heat loss (SMR or BMR), heat loss through conduction, convection and radiation (non-evaporative heat loss, Hs) was determined: Hs=SMR-He or Hs=BMR-He.
RESULTS
All the obtained data on heat loss at rest (BMR), existence energy and associated values measured (MPE, PPE, Tll, q, Hs, He, EWL, etc.) for all species for two seasons are summarised in Table 1 and Table 2. As an illustration, I give data for obtained values of energy metabolism for one passerine species, the Great Tit Parus major in graphic form (Fig. 1 & Fig. 2).
Thermal Conductance and Heat Loss
The dependence of the resting metabolic indices at night on ambient temperature (Fig. 1) exactly corresponds to Scholander's model: standard metabolic rate (SMR) decreasing per 1oC rise in TA, theoretically attaining zero at TA which is equal to body temperature (TB).
Birds are capable of changing their thermal conductance properties over a fairly wide range. This is attained by changing plumage position (compressing or ruffling ), as well as by changing the influx of blood to the skin which varies according to the demands of thermoregulation (vasomotor reactions). At rest thermal conductance ranged from the minimum (at low ambient temperatures) when insulation is maximum to the maximum (at high ambient temperatures) when insulation is minimal. Both minimal and maximal thermal conductances include evaporative and nonevaporative components.
Evaporative heat loss increases significantly in the thermoneutral zone, even though the birds increase thermal conductance. I determined the correlation between evaporative and non-evaporative heat losses at different ambient temperatures (Fig. 2), and the amount of heat dissipated through the body cover. This permits non-evaporative thermal conductance to be calculated.
Non-evaporative thermal conductance at low ambient temperatures (at TA<Tlc, when the bird minimises heat loss, hmin) is equal to:
(SMR-SMR %He1/100)-(BMR-BMR %He2/100
hmin=----------------------------------------------------------------
Tlc-TA
where SMR is standard metabolism at 0oC, %He1 is the percentage of evaporative heat loss at this temperature, BMR is basal metabolism, %He2 is the percentage of evaporative heat loss at TA=Tlc, Tlc is the lower critical temperature and TA - the ambient temperature at which SMR is measured (in this case 0oC).
Non-evaporative thermal conductance at high ambient temperatures (at TA=Tuc, when the bird acts as if it ‘undresses itself’ to maximizes heat loss, hmax):
BMR-BMR %He3 /100
hmax=------------------------------------
TB-Tuc
where %He3 is the percentage of evaporative heat loss at Tuc, Tuc is the upper critical temperature, TB is body temperature.
Within the thermoneutral zone, thermal conductance changes with the change of temperature from the minimum (hmin) to the maximum at Tuc (hmax). The hmin does not differ significantly from thermal conductance, including the evaporative heat loss of the whole bird at low TA--hl, since the proportion of heat dissipated by water evaporation at TA below Tlc is rather small and virtually the same at different TA values. Evaporative heat loss decreases only at very low TA (<-20oC). At high TA, non-evaporative thermal conductance differs from thermal conductance in the whole bird -- hu, (hu=BMR/(TB-Tuc) reflecting the increasing role of evaporative heat loss (Table 3).
The heat losses at minimal and maximal thermal conductance depend on ambient temperature and theoretically equal zero at TA=TB .
Existence metabolism
In the studied species, EM increases linearly with a decrease in ambient temperature outside the thermoneutral range (Fig. 1). In the temperature range from the lower sublethal temperature to the lower critical temperature EM can be expressed by a simple equation such as:
EM=hEM (TB-TA)+BMR (1)
where TB is the body temperature, TA is the ambient temperature and hEM is the experimentally derived constant indicating the change in existence energy at a change in EM by 1oC i.e., hEM is the temperature coefficient of the EM increase with the decrease of TA by 1oC or the heat transfer coefficient at existence, and BMR is the basal metabolism specially measured. This equation establishes the strong relation between EM and BMR. Therefore the equation obtained for EM, like the one for SMR, follows Newton's law in Scholander's interpretation. The thermal conductance in this equation is different (hEM) from the one for SMR.
Maximal existence metabolism
To quantify the amount of energy available to a bird at any ambient temperature, I measured the maximal existence metabolism or the maximum food energy that the bird can metabolise (MPE). The maximum food energy was measured in 6 species under different experimental conditions (Fig. 3).
During measurements of the maximal existence metabolism in some small species, I found a specific ambient temperature below which food consumption increased, but body mass continued to decline. In such cases, experiments were stopped and this temperature was considered as the lower sublethal temperature. The measurement of SMR was possible at temperatures below the lower sublethal temperature in these species. In these cases, EM was 8-10% higher than SMR according to the regressions of EM and SMR upon TA. In fact, in some species, Tll as determined by the equation crossover point method was the same as the ambient temperature at which 50% of the animals died. Thus, for some species, I used a combination of experimental data and calculations. For other species, I calculated Tll by assuming EM=SMR=MPE at this TA, and by using the equations for SMR and EM for those species from the equations:
MPE=hEM (TB-Tll)+BMR or MPE=hl (TB-Tll) and Tll=TB-BMR/(hl-hEM).
Experimental data show that MPE (maximal potential existence metabolism), in all the studied species fall within the range from 4.5 to 3.3 BMR per day or MPE»4BMR (Table 1).
Inter-relationship of the main components of energy metabolism
Let us consider the experimental model, representing changes of the main bird energy characteristics depending on TA (Fig. 4). The main components of energy metabolism are minimal and maximal heat losses. Maximal non-evaporative heat loss depends on ambient temperature in the same way as minimal non-evaporative heat loss. It is very important that the maximal and the minimal non-evaporative heat losses similarly depend on TA and theoretically are equal to zero at TA=TB, that is both minimal and maximal non-evaporative heat losses exactly follow Newton's law in Scholander's interpretation.
Between these two heat losses converging at TA=TB there is a metabolic temperature space where an animal can function for long period. Respiratory heat loss widens this space towards high TA (shown hatched in the figure), but existence at these ambient temperatures is possible only at a high level of water evaporation, and consequently, at its compensation.
Thus, daily energy expenditure (DEE) within which a bird can maintain an absolute value of energetic metabolism for a long period of time (including energy expenditure on behaviour and production) is determined by 4 parameters (see Fig. 4): the lower limit - by the level of BMR, the upper limit - by the level of MPE, in part by low temperatures - by the minimal heat loss, Qmin=hmin (TB-TA)»SMR, which reaches a limiting MPE level at TA=Tll, in part by high temperatures - by the maximal heat loss, Qmax=hmax (TB-TA), which reaches a limiting MPE level at TA=Tlc. Within these limits, metabolism can change under the influence of various external and internal factors. As a result, the temperature-energetic space or metabolic-temperature area (MT) where an animal can exist without energetic limitations may be defined as follows:
MT=[hmax (TB-Tlc)-hmin (TB-Tlc)] [(Tlc-Tll)+(Tuc-Tlc)]/2 (2)
or MT=(MPE-BMR) [(Tlc-Tll)+(Tuc-Tlc)]/2 (2a)
Evaporative heat loss somewhat enlarges this space at TA below Tlc, and at TA above Tuc the proportion of heat lost through water evaporation rapidly increases and reaches 100% at TA=TB (see Fig. 4). Thus MT is an indicator of the energetic and ecological capability of a species.
Allometric analysis
An allometric analysis of all the energetic values is given separately for two seasons (abbreviations S, Summer; W, Winter, respectively) and for two groups, the Passeriformes and Non-Passeriformes. All allometric regressions are summarised in Table 4, where the values of intercepts given for body mass m=1 kg. (In figures with allometric regressions the values of intercepts are given for body mass m=1 g.)
The ability of birds to change their heat loss
The ability to change heat loss without changing the level of heat production is proportional to the expression hu/hl, which when the dependencies of hu and hl on m are substituted gives the relationship:
Non-passerines:
Winter hu/hl=15.4m0.57/2.8m0.53=5.5m0.04
Summer hu/hl=17.0m0.58/3.3m0.55=5.1m0.03
Passerines:
Winter hu/hl=16.3m0.61/2.9m0.50=5.6m0.11
Summer hu/hl=18.0m0.62/3.0m0.49=6.0m0.13
Differences are significant (p<0.05) between the S and W values in both Passeriformes and non-Passeriformes and are not significant between Passeriformes and non-Passeriformes for S and W values.
This indicates that the capabilities of passerine and non-passerine birds differ only insignificantly and do not show seasonal variations. Since hu includes an essential share of heat loss through evaporation, it is important to determine the possibilities changes in heat loss resulting only from a change in the non-evaporative thermal conductance, i.e. proportional to hmax/hmin:
Non-passerines:
Winter hmax/hmin=9.7m0.5131/2.4m0.5154» 4
Summer hmax/hmin=10.9m0.5112/2.9m0.5370» 4
Passerines:
Winter hmax/hmin=9.6m0.4596/2.5m0.4817» 4
Summer hmax/hmin=10.6m0.4786/2.6m0.4791» 4
There are no differences in the mean non-evaporative thermal conductance between passerine and non-passerine birds. In both groups minimal and maximal thermal conductance similarly change with body mass (Fig. 5). At the same time non-evaporative maximal thermal conductance is approximately 4 times higher than minimal. Therefore birds can change their heat losses four-fold at the same temperature without intensifying evaporative heat loss. The equation number (3) was obtained.
hmax=4hmin (3)
This equation holds true for passerines and non-passerine birds. Hence, their abilities to change their thermal conductance are similar. This indicates the similarity of morphology and circulatory systems between these groups, the similarity of plumage properties and the ways in which they change their thermal conductance. It should be emphasised that minimal and maximal heat losses include heat loss not only through plumage, but also through uncovered skin surfaces, as well as vasomotor reactions. The more perfect is the circulatory system, the greater is the ratio of maximal and minimal thermal conductance. This, naturally, provides for many advantages for any kind of activity. The ratio of maximal and minimal thermal conductance equal to 4 holds true for both passerine and non-passerine birds and has exceptional significance for understanding bird energetics.
Maximal, potential productive and normal levels of existence metabolism
The EM value at 30° C
(i.e. at TA within the thermoneutral range in all the studied
species) varied from 1.8BMR to 1.2BMR and had some
specific problem which should be mentioned here. The dependence of EM at 30° C on
body mass has a shallower regression lines slope than does that of basal metabolism
on body mass. As EM is described by the equation EM=hEM (TB-TA)+BMR,
the most suitable measurements of EM should be made outside the thermoneutral
range. If or as the energetic parameter for resting metabolism at 0° C exists, it
is reasonable to have such a parameter for EM. The EM value at 0° C varies
from 1.5BMR in large species to 4BMR in small species (Table 1). In small southern species EM value at 0° C
corresponds to the value of MPE. The measurement data show that there are no
differences in the mean existence metabolism at 0oC between passerine and
non-passerine birds. In both groups EM at 0oC changes with changes in
body mass in a similar manner, and the slopes of the regression lines are identical (Fig. 6).
Equations for dependence of maximal existence metabolism on body mass have a similar exponent at body mass in passerine and non-passerine birds. These exponents are lower than those for BMR (Fig. 7). The BMR and MPE levels in passerine birds is 25-27% higher than in non-passerine birds. Differences are significant (p<0.05). This is why passerines survive at lower ambient temperatures and the lower limit of their temperature tolerance (Tll) is not significantly lower than that in non-passerines (Fig. 8).
On the other hand, passerines have a higher potential productive energy (PPE), defined as the difference between MPE and existence metabolism at the same TA (Fig. 9). Differences are significant (p<0.05).
The optimal temperature for productive processes (Topt), determined from the equation MPE=hmax(TB-Topt) and Topt=TB-MPE/hmax, almost matches the lower critical temperature (Fig. 10). The dependence of optimal temperature on body mass is similar to that of lower critical temperature. Optimal temperature is considerably lower in passerine. In moderate climate this shift of optimal temperature allows a bird to increase productive energy, and, hence, to ensure productive processes (reproduction, moult, etc). For example, the well-known ecogeographical rule of clutch size increase in the northern passerine birds is also related to this benefit. The reserve of productive energy allows birds to increase moult rate in the north.
DISCUSSION
The empirical data of DEE in different groups of birds give a range of multiple values at BMR: from 1.5 to 9-12 (see review Dolnik, 1995). This has given rise to a discussion on the true value of the multiple value at BMR (see, for example, Calder, 1974, 1984; Calder and King, 1974; Kendeigh et al., 1977; Drent and Daan, 1980; Bryant and Tatner, 1991; Dolnik, 1995; Ricklefs, Konarzewski and Daan, 1996 etc.). Although will not discuss all these publications, as well as the first publications in this field (Brody, 1945; King and Farner, 1961; Kleiber, 1961) here, I propose that the maximal daily multiple value at BMR with relation on DEE is determined by experimentally obtained Equation (3): hmax=4hmin.
Let us consider the level of metabolism per day at TA=Tlc (Fig. 1 and Fig 4) at minimal thermal conductance:
Qmin=hmin(TB-Tlc)=BMR,
and at maximal thermal conductance:
Qmax=hmax(TB-Tlc)=4BMR as hmax=4hmin
According the equation number (3), birds, with no increase in evaporation at lower critical temperature, can dissipate 4BMR of heat regardless of their size, and their maximal metabolic power at this temperature may be equal to 4BMR per day for an unlimited period of time. This is corroborated by experimental data on potential energy for both birds and mammals. Obtained equations do not differ significantly from those given by Calder for Hmax,W =4.6m0.65 (m, g)(Calder, 1974), in value with corresponding the data of Saarela et al. (1989) and the equation MEmax,W =2.8m0.72 (m, g) (Kirkwood,1983), but since no distinction was made in this study between passerines and non-passerines, they do differ in the exponent. Certainly it does not contradict the fact that metabolic power may considerably exceed this level during the short time periods (for example, daily energy expenditure in some species may reach 10-12 BMR during several days). But then considerable time is required later to replenish the energy stock.
Thus, it can be considered that the potential existence metabolism in all birds is 4BMR. This is in exact agreement with the ability of birds to control and alter their heat losses. Birds are capable of 4 fold altering of their heat losses under any given TA. It is inferred from the equation (3) obtained experimentally.
The basal metabolic rate in homeothermic animals as a fundamental scale of its energetic power and an indicator of the maximal level of the daily work output
Passerines MPE
is 1.3-1.5 times higher than that in non-passerines indicating that
small passerine birds exceed non-passerines in productivity if their product
synthesis efficiency is equal.
The obtained regressions show
that the production in small passerines with body mass lesser than 100 g
is higher than that in non-passerines of the same size. These data also show that all
birds are able to develops metabolic power equal to 4BMR (Table 1). The combination of this conclusion and equation (1)
for EM, which related the strong correlation between EM and BMR,
demonstrate that BMR determines the level of daily work output (DWO) which
an animal is capable of exerting during a day (day = 24 hours).
I define the work
output as the amount of work, which an animal spends on any locomotor
activity. So the work output is equal to the mechanic energy which develops as a result of
metabolic rate. Thus it is a product of the total level of metabolism and of an efficiency
of transformation of metabolic energy to the mechanical form.
Empirical data indicate that the daily energy expenditure (DEE) of the studied species depends on the ambient temperature and can be described by the following equation derived from Equation (1):
DEE=h(TB-TA)+aBMR (4),
where DEE - the daily energy expenditure at the ambient temperature (TA<Tlc); h - temperature coefficient of the DEE increase with the decrease of TA, which changes according locomotor activity level from hl (at maximal isolation and minimal activity level, i.e. at rest) to ha (at other daily activity levels); a - daily level of activity (at a=0, DEE=SMR; at a=1, DEE=EM), TB - body temperature equal to 40o in birds; TA - ambient temperature; BMR - basal metabolism.
Equation (4) describes the heat balance of the active animal. Thus the regression line of the metabolic level on temperature in the active animal at TA=TB should have a value which is different from zero (in the animal at rest this value theoretically is equal to zero). This value is different at different levels of activity (at the level of activity equal to 1 it is BMR, in a general form - aBMR). As soon as an animal starts any locomotor activity (i.e. any mechanical work), the transformation efficiency from metabolic to mechanical power becomes an important element of the equation. This is why Equation (4) DEE=h(TB-TA)+aBMR includes the efficiency - a, with the coefficient representing the level of activity. The element h(TB-TA) in the equation (4) reflects the necessity to keep the body temperature constant at changing TA. Part of the energy described by h(TB-TA) is used for mechanical work with efficiency equl to the transformation efficiency from metabolic to mechanical power ( a). In element h(TB-TA) the value of the temperature coefficient of the increase in DEE with the decrease of TA (i.e. at activity) - ha - is smaller than at rest - hl, as the heat production caused by locomotor activity may partly compensate for the thermoregulation expenditures. A part of the energy, which may partly compensate for the thermoregulation expenditures, depends on the level of locomotor activity. The level of locomotory activity (a) determines how much energy is available to compensate for thermoregulatory expenditures. Thus the temperature coefficient of the increase in DEE with the decrease of TA (i.e. temperature coefficient of active animal) is: ha=hl(1-aa). EM is defined as energy expenditure at the level of locomotor activity a equal to 1, and in this case ha=hEM. Therefore the measured value of hEM includes an efficiency at the level of activity equal to 1. Hence, the difference between 1 and the relation of the value of hEM and the value of hl is equal to the value of efficiency: a=1- hEM/ hl. Thus the temperature coefficient of the EM increases with the decrease of TA (i.e. temperature coefficient) at existence is equal to: hEM=hl(1-a). Then equation (4) for the case of EM, i.e. daily energy expenditure at the level of locomotor activity equal to 1, may be represented as: EM=hl(1-a)(TB-TA)+BMR. On other levels of locomotor activity part of the energy, which may partly compensate for the thermoregulation expenditures, will decrease temperature coefficient according to the relationship
ha=hl(1-aa).
Energy expenditure on other levels of locomotor activity (a) can be described by the following equations:
DEE=hl(1-aa)(TB-TA)+aBMR (5)
The scheme of the increase in the level of locomotor activity a and its influence on DEE and heat transfer coefficient is shown in Fig. 11. The level of locomotor activity a correspond to the DEE/BMR, when TA equalls TB (Fig. 11). The heat transfer coefficient at activity (hEM) changes depending on the activity of birds in the same fashion as it has been demonstrated for the changes of heat transfer coefficient at different TA depending on the speed of locomotion (Kendeigh et al., 1977; Paladino and King, 1984). This shows, that along with the increase in the level of activity, there is a decrease of heat transfer coefficient.
The equation (5) shows that it is the BMR that indicates the level of the daily work output (DWO) which an animal is capable to do during long periods every day, if the amount of food be ad libitum. Indeed, DWO is equal to the product of the total level of energetic metabolism (DEE) multiplied by the efficiency, i.e. DWO=aDEE or DWO=hl(1-aa)(TB-TA)+aaBMR. The potential energetic capability is maximal at TA=Tlc, where DEE=4BMR (in this case DEE=MPE). Hence follows that the level of activity for a day should not exceed 4 numerical equivalents, in the opposite case the energetic balance will be disturbed. Thus the level activity for a day may varied from 0 (at full rest) to 4. By virtue of the fact that the efficiency a style="line-height: 20px"> is equal to 0.25, and the maximal level of daily activity is 4 numerical equivalents, it follows:
DWO=hl (1-4x0.25) (TB-TA)+4x0.25xBMR=BMR.
So it is the BMR that determines the level of the work output per day. In this way, the level of BMR is the measure of DWO that an animal can perform over a considerable period of time, and the mechanical energy expended on any locomotor activity of the animal is equal to the energy expended on maintaining its basic physiological processes. The final equality means that the mechanical energy for the animal to move in the environment comes from the body's internal stores.
These data enabled us to propose a new concept. The concept explains the functional role of an increase in the BMR in birds. The increase in BMR, both in course of evolution (as it takes place in Passeriformes) and in a particular bird, should correlate strongly with the increase in maximal existence metabolism (MPE equal to 4BMR), potential productive energy and daily work output. Therefore the value of BMR is the fundamental scale of power that determines the intensity of real interaction of an individual with its environment. This conclusion confirms the point of view that the emergence of endothermy in evolution should be associated not with the requirement of thermoregulation but with the requirements to perform an activity (Bennet and Ruben, 1979).
Fig. 12 illustrates the functional implication of increase in BMR level in the course of evolution or in a particular animal: the increase in BMR strongly correlates with the increase in potential energy or maximal existence metabolism or maximum food energy (MPE equal to 4BMR). The increase in BMR strongly correlates also with the increase in maximal aerobic metabolism that is equal to 16BMR in different groups of animals. The increase in BMR level by 30% in Passerines results in a proportional increase in MPE and maximal aerobic metabolism.
The transformation efficiency from metabolic to mechanical power
The efficiency of
transformation of metabolic power to the mechanical form can be estimated using the
equation hEM= hl(1-a) and, consequently, a=1- hEM/hl
gives the value a »0.25
(empirical data for 1- hEM/hl relation from Table 1). These experimental data agree well with similar
values in homeothermic animals (ranges 0.25 to 0.4), as shown by
various experiments and theoretical predictions (Brody, 1945; Hill, 1960; Kleiber, 1972;
Cavagna and Haneko, 1977; Taylor et al., 1980; Gorshkov, 1984). The dependence of
the efficiency of transformation of metabolic energy into mechanical energy on body mass
has not been reported in the literature. However, some measurements and theoretical
predictions have shown that the efficiency of transformation of metabolic energy into the
mechanical form in animals may increase with an increase in body size and with increased
activity (Gorshkov, 1984). My analysis shows that the dependences of a=1-hEM/hl
on body mass in both groups give similar small positive exponents (Fig.
13).
The efficiency of metabolic power transformation into a mechanical form must, in principle, be proportional to its ability to dissipate excess heat, developed as a result of locomotory activity or at high ambient temperature. The ability to dissipate excess heat is proportional to the hmax/hmin ratio, and the efficiency will appear as: hmin/hmax and, consequently, equal to 1/4. All experimental data correspond exactly with this value of the efficiency of transformation of metabolic energy into mechanical energy in homeothermic animals. The efficiency will diminish with an increase in the hmax/hmin relationship. Apparently this is why homeothermic animals have what appears to be an intermediate ratio: hmax/hmin=4. An increase in the hmax/hmin ratio lowers the efficiency of transformation of metabolic energy into the mechanical form (at a ratio equal to 5 the efficiency is equal to 0.20, at 6 - 0.17, etc.). Thus it is possible to propose that the efficiency of metabolic power transformation into mechanical power is equal to hmin/hmax and, consequently, equal to 1/4. That is why the seemingly favourable increase in maximal heat conductance relative to the minimum would lower the efficiency of metabolic power transformation into the mechanical form and so is not utilised by homeothermic animals.
Ecological implication of differences in energetic parameters between passerine birds and all other birds
The different exponents in the equations of MPE, PPE and BMR dependence on body mass (Table 4) point to the large available power of existence in small birds, especially in passerines. This although shows that small-sized passerine birds, feeding on accessible food, may successfully exist during the whole year in regions with extremely low temperatures (for example in Siberia, where in winter the temperature reaches -70o C, successfully live Siberia Jay, Perisoreus infaustus, Siberia Tit, Parus cinctus, etc., in the North of Europe and Asia, where in winter the temperature reaches -50o C residently lives Snow Bunting, Plectrophenax nivalis and Lapland Bunting, Calcarius laponicus, etc.).
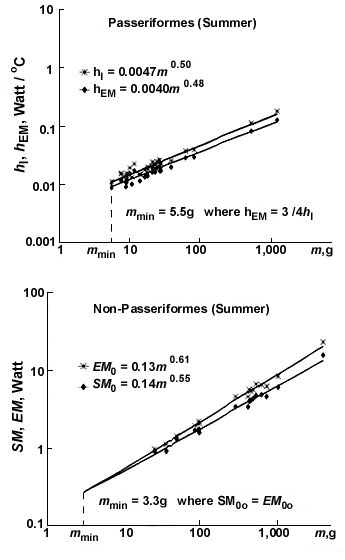
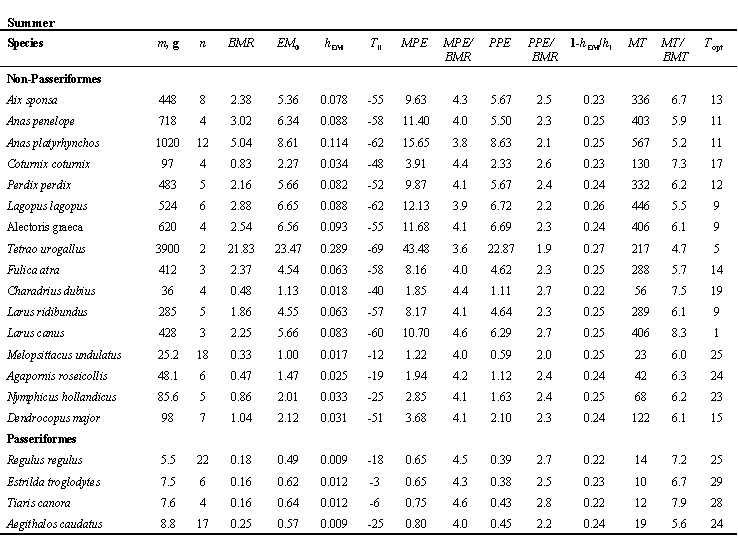
Due to the essential MPE differences in small forms of passerine and non-passerine birds, the minimal sizes in these two groups are controlled by quite different conditions: in non-passerines m=mmin at EM=SM and mmin - 3.2 g, in passerines due to high BMR, for small birds to move without overheating hEM=0.75hl and mmin=5.3 g (Fig. 14). These values are in good agreement with the real body mass values of the smallest non-passerines (hummingbird, Trochilidae) and passerines (Goldcrest, Regulus regulus).
The maximal sizes in these 2 groups are controlled in the following manner. In passerines advantages of high BMR level disappear if body mass become less than 1.4 kg. In a fact there are no animals possessing simultaneously a BMR level available to passerines and a body mass more than 1.4 kg, because Tuc in such animals would be lower than the mean maximal temperature, which continued for a relatively long period on the Earth. This is why all birds larger than 1.4 kg are non-passerines, i.e. they have lower BMR level. In non-passerines, if they do not fly, there is no energy limit for maximal sizes (apparently related to potentials of the skeleton in connection with bipedality), if they do fly, the maximal sizes are controlled by the energy available for movement (Wilkie, 1959; Dolnik, 1969; Gavrilov and Dolnik, 1983).
Thus, the potential energy difference in passerine and non- passerine birds determine the other important elements of energetics and ecology of these groups. The character of the obtained allometric dependencies explains the contemporary state of dimensional ranges of orders, the general principles of passerine and non-passerine bird distribution along the north- south line, the differences in application of Bergmann's rule to passerine and non-passerine birds, the main differences in the expenditure of productive energy and some other features of ecology and bird energetics.
Passerine birds, especially small ones, have an available existence power 30% higher than that of non-passerines. One can say that in the range of smaller birds the energy potentials of passerine birds are significantly higher than those of non-passerines. Probably, that is why the ecological niches most favourable for small f
orms, are occupied primarily by passerines. Note that passerine birds prefer forest habitats. It can be assumed that evolution development of Passeriformes is associated with their expansion to forest habitats. Their adaptive radiation appears to be a result of this process. Thus, the size range of 5-150 g for birds in forest habitats is almost exclusively taken up by passerines, as a consequence of their large energetic capacity.
The BMR level, particularly the relation of BMR to body mass with exponent 3/4 will indicate the ability of an animal (or a human) to perform work and allow us to estimate its amount. Thus, BMR/m3/4 is an interspecific indicator of daily work output and may be applied to general physiology, ecology and sports medicine. In terms of whole population, the diversity of the BMR level is a basic factor accounting for the social position of birds in population.
The advantage of increased BMR are, therefore, not an unmixed blessing, since they entail so great a cost. For existence a passerine bird needs to increase its food intake by 30-50% or more, at the same time it would increase its exposure to danger. In Passeriformes, EWL is about 25 - 40% higher than in Non-Passeriformes (especially at high TA) (Gavrilov, 1997), which also would increase its exposure to danger. It is difficult to believe that these metabolic increments occur for strictly thermoregulatory purposes because Passeriformes originated in Mesozoic, the most thermally stabile period in the history of the Earth.
The selective advantages of increased daily work output (or capability of activity) effected by a high basal metabolism are not subtle but, on the contrary essential to survival and reproduction. An animal with a capability of a greater work output has an advantage, which is quite obvious in terms of selection. It can sustain higher levels of pursuit or flight in gathering food or avoiding to becoming food. It will be superior in territorial defence. It will be more successful in courtship and mating, since the enhanced capabilities give their owner the ability to increase energy intake to meet new energy demands.
ACKNOWLEDGMENTS
I want to express my sincere thanks to Prof. V.R. Dolnik, who helped me a great deal in my studies and with whom I have been working for a long time. I am grateful to Prof. V.G.Gorshkov, Academician I.A.Shilov and Prof. K.A.Nagy for valuable critical comments and consultations, Dr. T.B.Golubeva and Dr. L.I.Alexandrov for support and for patient and perceptive help in the work, and to Prof K. A.Nagy for all-around help in the preparing and presentation of this manuscript. I am also grateful to Dr. A.B. Kerimov, who performed most of the field experiments and stimulated the application of fundamental avian energetics to population studies. I am indebted to the Directorate and Scientific Council of Zvenigorod Biological Station of Moscow State University for the opportunity to carry out experimental studies and prepare material for these studies. The studies were supported by the Russian Foundation for Fundamental Research (Grant 99-04-49105 and 99-04-49074). The concluding part of the studies was stimulated by the High Education Department (Program: 'Fundamental problems in natural sciences' and 'Universities of Russia, Fundamental Research').
REFERENCES
Bennet, A.F. & Ruben, J.A. 1979. Endothermy and activity in vertebrates. Science, 206, N 4419, 649-654.
Brody, G. 1945. Bioenergetics and growth. New York: Reinhold, 1023 p.
Calder, W.A. 1974. Consequences of body size for avian energetics. In Avian energetics edited by R.A.Paynter, N 15, pp. 86-151, Cambridge, Massachusetts: Nuttall Ornithological Club Publication.
Calder, W.A. 1984. Size, function, and life history. 431 p., Cambridge, Massachusetts: Harvard University Press.
Calder, W.A. & King, J.R. 1974. Thermal and caloric relations of birds. In Avian Biology, edited by D.S. Farner and J.R. King, Vol. 4, pp. 259-413, New York: Academic Press.
Cavagna, G.A. & M.Haneko. 1977. Mechanical work and efficiency in level walking and running. J. Physiol., 268, 467.
Dolnik, V.R. 1969. Bioenergetyics of a flying bird, Zh. Obsch. Biol., 30, 273-291 (in Russian, English summary).
Dolnik, V.R. 1995. Energy and time resources in free-living birds. (St. Petersburg: Nauka) (in Russian, English summary).
Dolnik, V.R., & Gavrilov, V.M. 1982. Energetics of the chaffinch during non-productive seasons. In Population Ecology of the Chaffinch (Fringilla coelebs) edited by V.R. Dolnik, pp. 41-63, Leningrad: Nauka (in Russian, English Summary).
Drent, R.H. 1973. The natural history of incubation. In Breeding Biology of Birds, edited by D.S.Farner, pp. 262-311, Nat. Acad. Sci. Washington, DC.
Drent, R.H., & Daan, S. 1980. The prudent parent:: energetic adjustments in avian breeding. Ardea, 68 (2), 225-252.
Gavrilov, V.M. 1997. Energetics and Avian behavior . Physiology and General Biology Reviews. Amsterdam B.V. Published in The Netherlands by Harwood Academic Publishers GmbH, 225p.
Gavrilov, V.M. & Dolnik, V.R. 1983. The metabolic cost of flight in birds as dependent on body weight. Communications of the Baltic Commission for the Study of Bird Migrations), 15, 66-82, (in Russian, English summary)
Gorshkov, V.G. 1984. Energetic efficiency of flight and swimming. Zh. Obshch. Biol., 45, pp. 779-795 (in Russian, English summary)
Hill, A.V. 1960. Production and absorption of work by muscle. Science, 131, 897-898
Kendeigh, S.C., V.R.Dolnik, V.R. &.Gavrilov, V.M. 1977 Avian energetics. In Granivourus birds in ecosystems, edited by G. Pinowski and S.C. Kendeigh, International Biological Programme, vol. 12, pp. 127-204, Appendix:363-378, Cambridge University Press
King, J.R. & Farner, D.S. 1961 Energy metabolism, thermoregulation and body temperature. In Biology and Physiology of birds, edited by A.J.Marshall, pp. 215-288
Kirkwood, J.K. 1983. A limit to metabolizable energy intake in mammals and birds. Comp. Biochem. Physiol., 75 A, pp.1-3
Kleiber, M. 1961. The Fire of Life. 320 p., New York: John Wiley and Sons
Kleiber, M. 1972. Body size, conductance for animal heat flow and Newton's law of cooling. J. Theoretic. Biol., 37, 130-150
Paladino, F.V. & King. J.R. 1984. Thermoregulation and oxygen consumption during terrestrial locomotion by White-crowned sparrows Zonotrichia leycophris gambelii. Physiol. Zool., 57, 226-236.
Peters, R. 1983. Ecological implication of body size (Cambridge, Massachusetts: Harvard University Press).
Prosser, C.L. 1973. Comparative Animal Physiology, edited by C.L. Prosser, 966 p., Philadelphia: W.B.Saunders.
Saarela, S., Klapper, B. & Helmaier, G. 1989. Thermogenic capacity of green-finches and siskins in winter and summer. In Physiology of cold adaptation in birds, edited by C. Bech and Reinertsen, pp.17-21, Plenum Publishing Corporation.
Ricklefs, R E, Konarewski, M.& Daan, S. 1996. The relationship between basal metabolic rate and daily energy expenditure in birds and mammals. American Naturalist147:1047-1071.
Taylor, I.R., Heglund, N.C., McMahon, T.A. & Looney, T.R. 1980. Energetic cost of generating muscular force during running. J. Exp. Biol., 86, 9
Wilkie, D.R. 1959. The work output of animals: Flight by birds and by man-power. Nature (London), 183, 1515-1516.
Table 1. Existence, productive and maximal metabolism in Non-Passeriformes and Passeriformes in summer and winter.

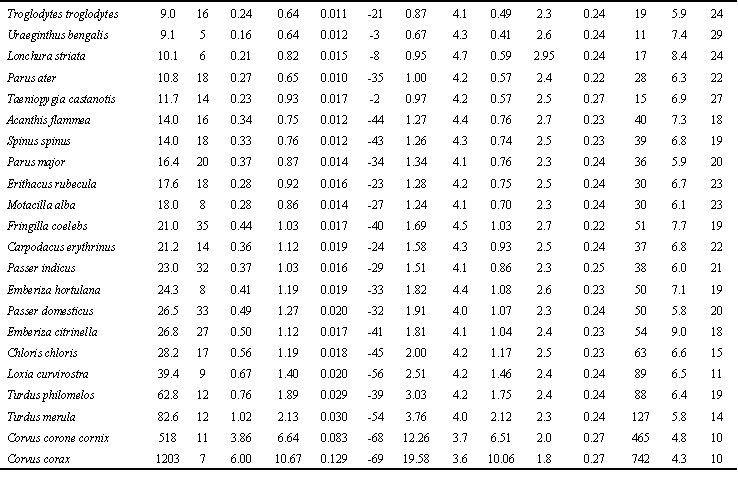
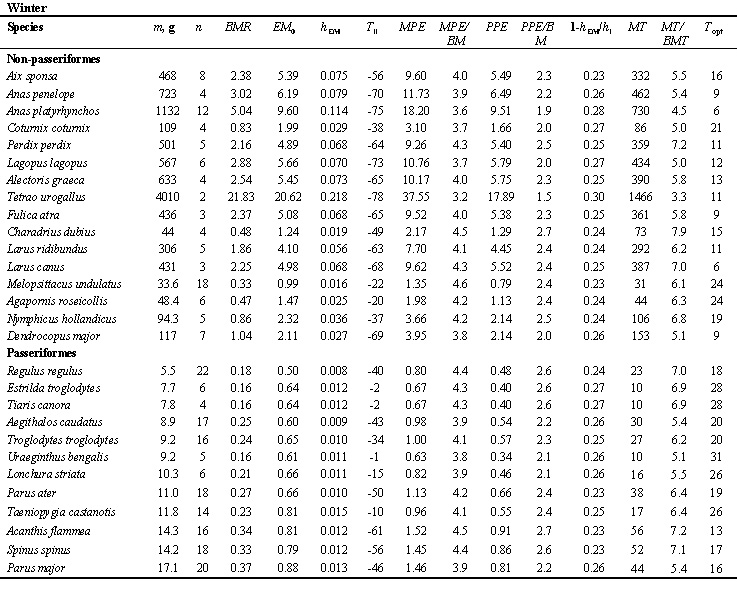
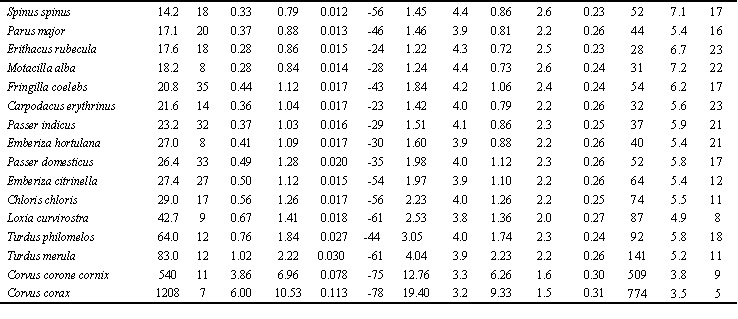
Abbreviations: m, average body mass; n, number of estimation bird; BMR, basal metabolic rate, Watt; EM0, existence metabolism at 0oC, Watt; hEM, temperature coefficient of the EM increase with the decrease of TA by 1oC, Watt per oC; Tll, lower limit temperature tolerance, oC; MPE, maximal existence metabolism or maximum food energy, Watt; MPE/BMR ratio; PPE, potential productive energy, Watt; PPE/BMR, ratio; a=1-hEM/hl, efficiency of transformation of metabolic power to the mechanical form, hEM/hl ratio (hl, thermal conductance at rest); MT ‘temperature-energetic range’, Watt*oC; MT/BMT, ratio (BMT, an area where energy expenditure is constant, i.e. equal to BMR, BMT=BM*(TB-Tlc); Topt, optimal temperature for productive processes (Topt=TB-MPE/hmax), oC.
Table 2. Calorific equivivalent (q, Watt/g), percent heat loss with evaporation (He,%), evaporative heat loss (He, Watt), nonevaporative heat loss (Hs, Watt) and evaporative water loss (EWL, g/day) at different ambient temperatures (T
A) in Non-Passeriformes and Passeriformes birds in summer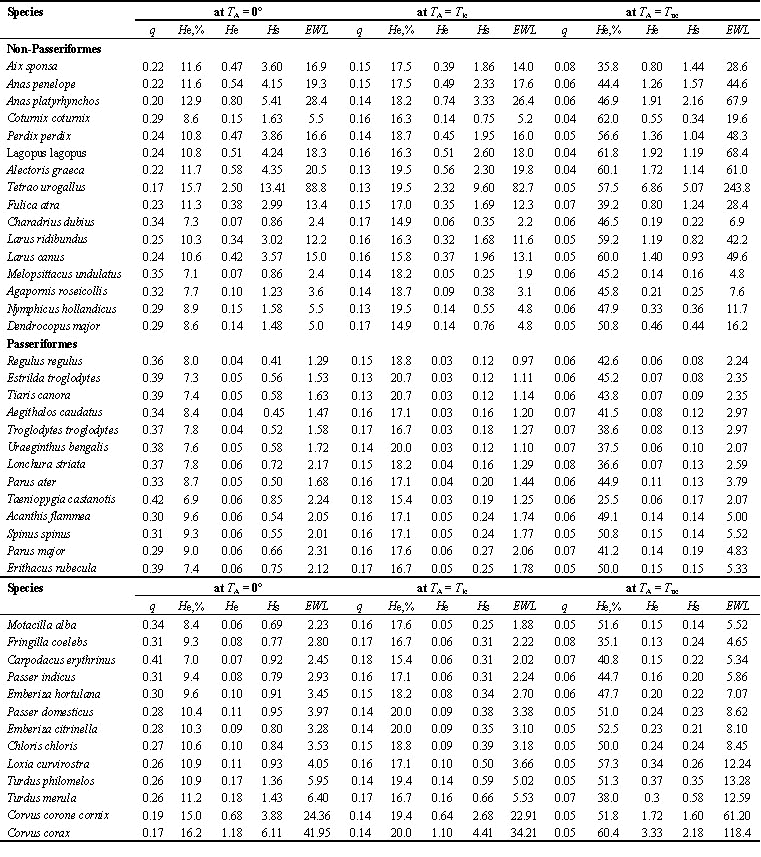
Abbreviations: q, calorific equivalent of loss body mass, Watt/g; He,%, percentage evaporative heat loss; He, evaporative heat loss, Watt; Hs, non-evaporative heat loss, Watt; EWL, evaporative water loss, gH2O/day; TA, ambient temperatures, Tlc, lower critical temperature; Tuc, upper critical temperature. Average body mass and number of estimation bird as in Table 1
Table 3. The minimal (hmin) and maximal (hmax) nonevaporative thermal conductance, minimal thermal conductance with evaporation (hl), temperature coefficient of the EM increase with the decrease of ambient temperature (hEM) and the efficiency of transformation of metabolic power to the mechanical form(a) in Non-Passeriformes and Passeriformes birds in summer
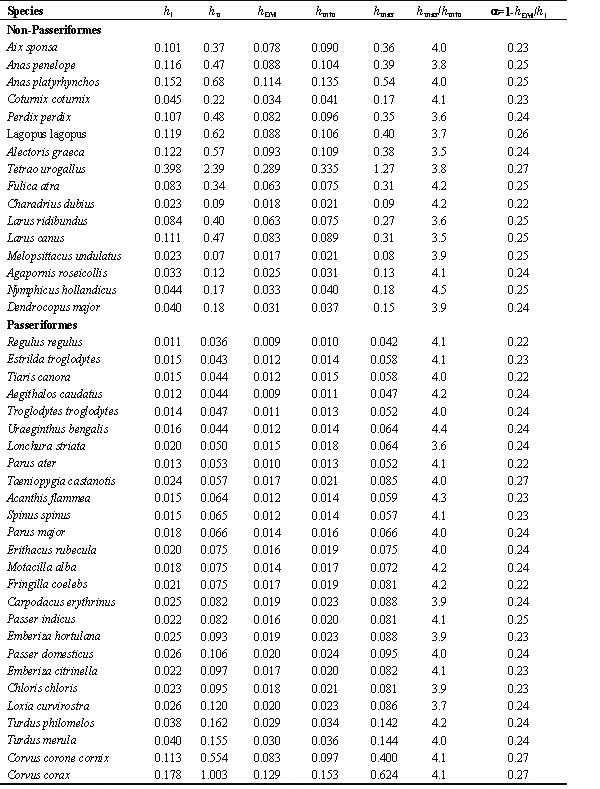
Abbreviations: hl, thermal conductance at low temperatures; hu, thermal conductance at upper critical temperature (hu=BMR/(TB-Tuc); hEM, temperature coefficient of the EM increase with the decrease of TA by 1oC, Watt per oC; hmin=(SMR-SMR %He1/100)-(BMR-BMR %He2/100)/(Tlc-TA), Watt per oC , where SMR is standard metabolism at 0oC, %He1 is the percentage of evaporative heat loss at this temperature, BMR is basal metabolism, %He2 is the percentage of evaporative heat loss at TA=Tlc, Tlc is the lower critical temperature and TA - the ambient temperature at which SMR is measured (in this case 0oC); hmax=BMR-(BMR %He3 /100)/(TB-Tuc), Watt per oC, where %He3 is the percentage of evaporative heat loss at Tuc, Tuc is the upper critical temperature, TB is body temperature. Average body mass and number of estimation bird as in Table 1.
Table 4. Allometric equations (P=amb, where P - energetic parameter, a - intersept, b - slope, m - body mass, kg) seasonal changes (S -summer, W -winter) for components of energetics in Passeriformes and Non-Passeriformes birds
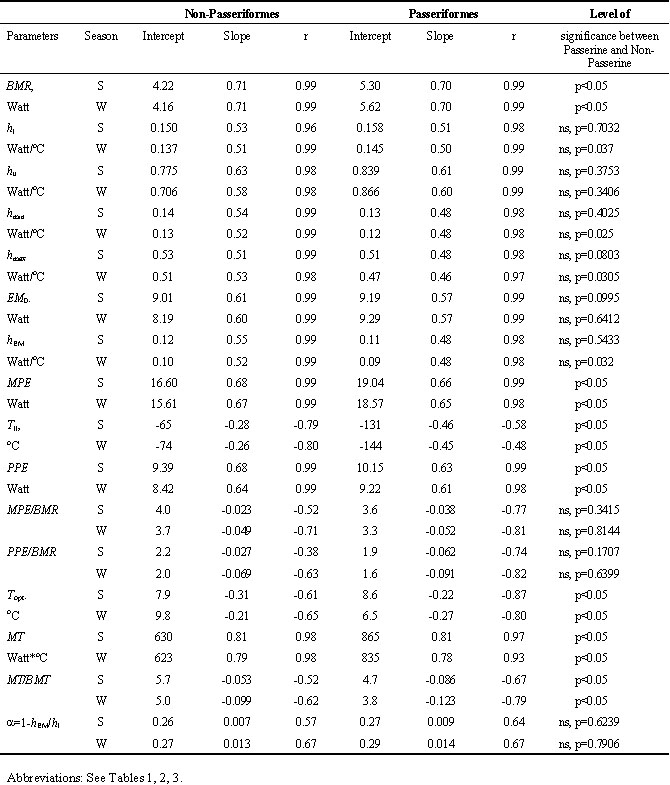
Fig. 1. Relation of energy expenditure at rest (SMR, oxygen consumption) and existence energy (EM, food consumption) in Parus major in Summer and in Winter. Maximal potential metabolic existence energy (MPE) in the Great Tits at a given ambient temperature was determined by maximum food intake in birds with elevated metabolism from thyroxine injection.
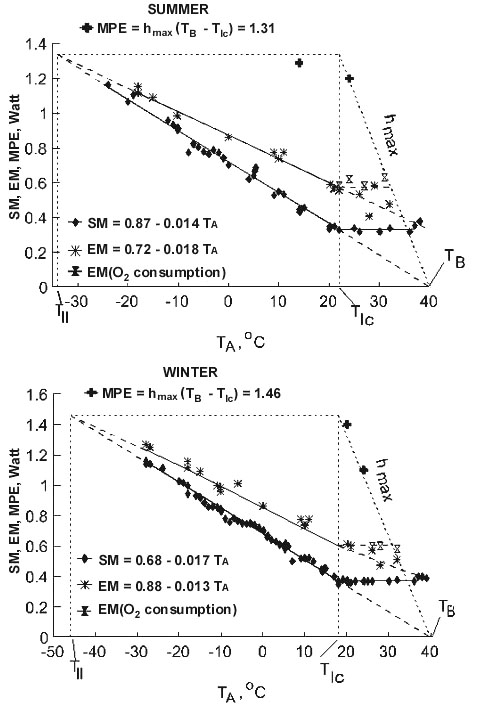
Fig. 2. Relation of energy expenditure at rest (SMR, oxygen consumption, dotted line), calorific value of the loss of body mass (q=SMR/dm; vertical lines - SE) (bottom), evaporative heat loss (He), nonevaporative heat loss (Hs) and per cent of heat loss through evaporation (He,%) (top) - to ambient temperature (TA, oC) in Parus major in Summer and in Winter.
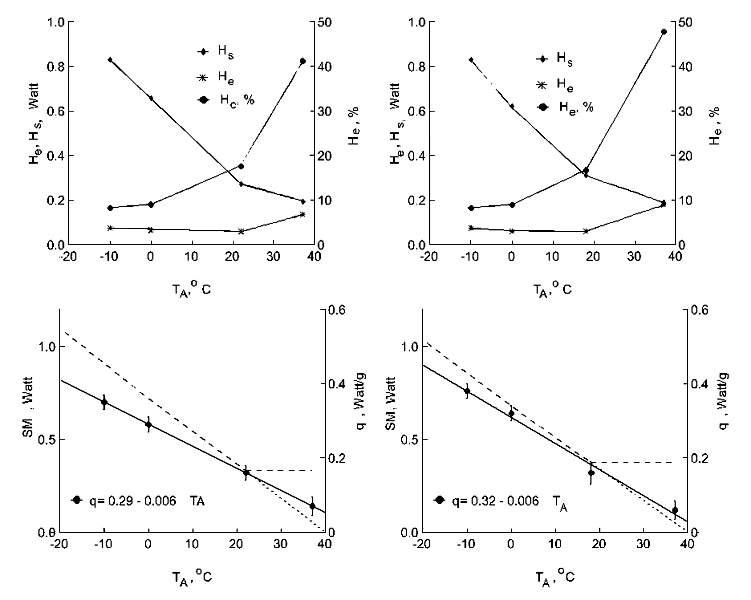
Fig. 3. Maximal existence metabolism (MPE, Watt, ordinate) in the Chaffinch at various ambient temperatures (TA, oC) was determined by maximum food intake under different experimental conditions. (1) sublethal low TA; (2) activation of metabolism by thyroxin injection; (3) depression of the moult rate by high TA; (4) birds without plumage cover
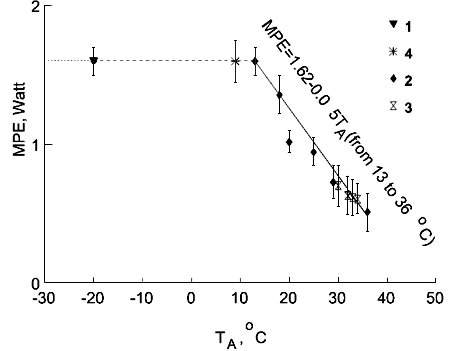
Fig. 4. Energetic model of a bird, which is constructed herein, and which summarises the results obtained. The model shows dependence of energetic parameters on ambient temperatures (TA); the shaded region reveals evaporative heat loss. See text for explanations.
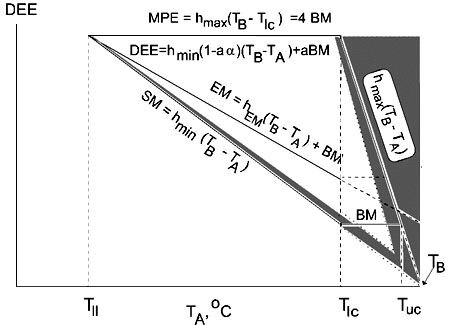
Fig. 5. Relationships of non-evaporative maximal (hmax) and minimal (hmin) thermal conductance to body mass (m) in Passeriformes and non-Passeriformes in summer and winter.
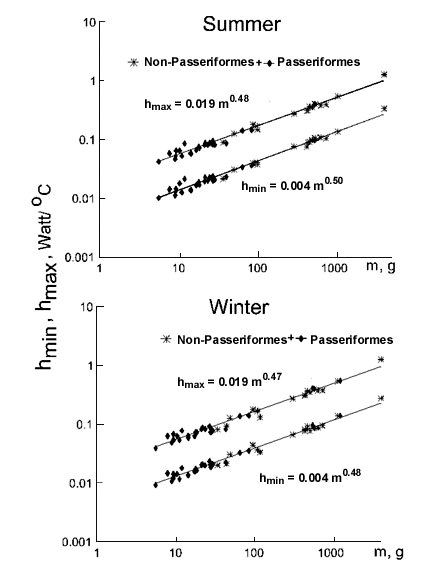
Fig. 6. Relationships of existence metabolism at 0°C (EM, W) to body mass (m, g) in Passeriformes and non-Passeriformes in summer (top) and in winter (bottom).
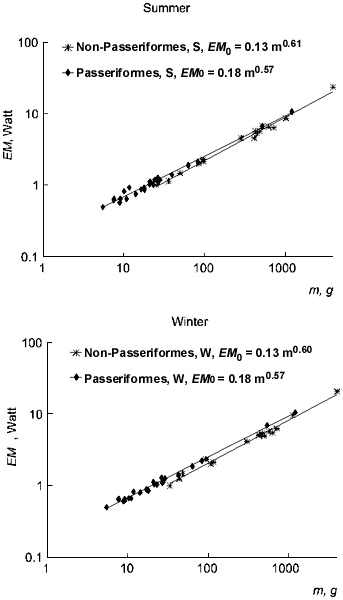
Fig. 7. Relationships of maximal existence metabolism (MPE, W) and basal metabolism (BMR, W) to body mass (m, g) in Passeriformes and non-Passeriformes in summer (top) and in winter (bottom).
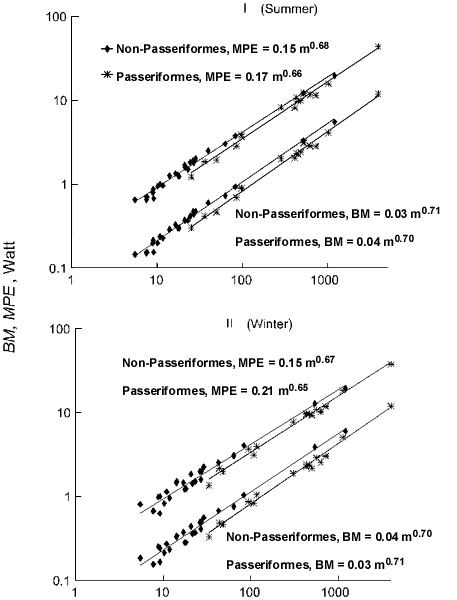
Fig. 8. Relationships of the lower limit of temperature tolerance (Tll, °C) to body mass (m, g) in Passeriformes and non-Passeriformes in summer (top) and in winter (bottom). Regressions were calculated for absolute values, and lines were drawn by hand.
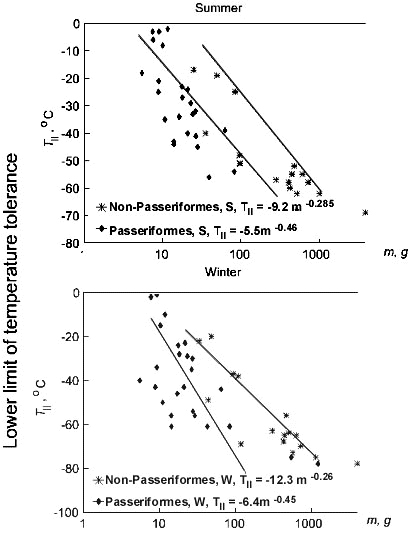
Fig. 9. Relationships of maximal potential productive energy (PPE, W) to body mass (m, g) in Passeriformes and non-Passeriformes in summer (top) and in winter (bottom).
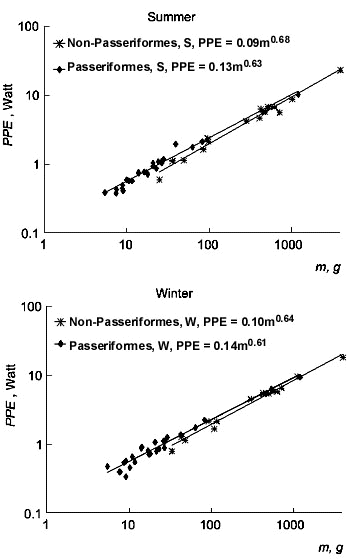
Fig. 10. Relationships of optimal temperature for production (Topt, °C) to body mass (m, g) in Passeriformes and non-Passeriformes in summer (top) and in winter (bottom).
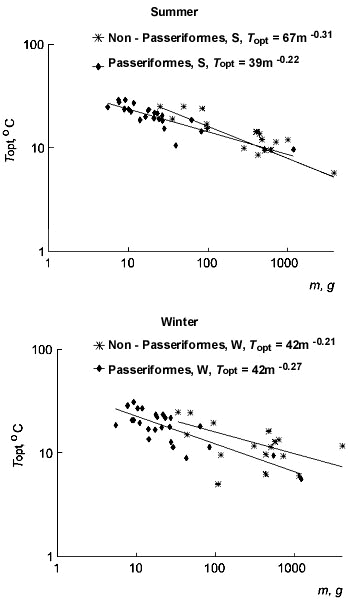
Fig. 11. Illustration of the significance of increase in the level of locomotor activity: the increase in the level of locomotor activity, a, strongly correlates with the increase in DEE and with a decrease in the heat transfer coefficient during activity.
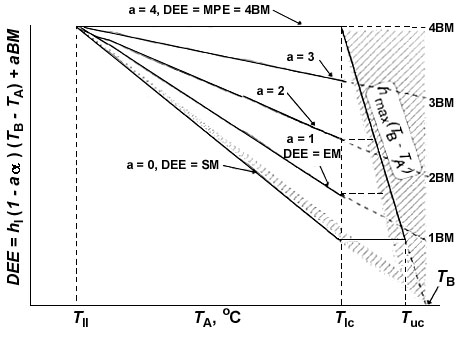
Fig. 12. Illustration of the significance of the increase in BMR in the course of the evolution of the Passeriformes: the increase in BMR strongly correlates with the increase in maximal existence energy (MPE equal to 4BMR) and with the increase in maximal aerobic metabolism (MAM equal to 16BMR in different groups of animals). The increase in BMR by 1.5 times (right) in passerines results in a proportional increase in MPE and maximal aerobic metabolism. See text for explanations.
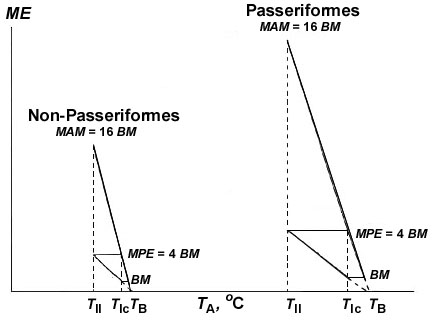
Fig. 13. Relationships of efficiency of transformation of metabolic energy into a mechanical form during activity (a=1-hEM/hl) to body mass (m, g) in Passeriformes and non-Passeriformes in summer (top) and in winter (bottom).
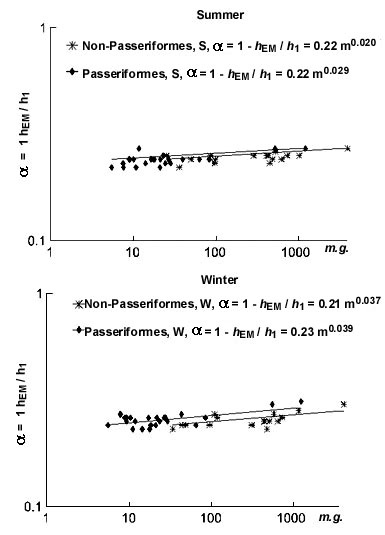
Fig. 14. Illustration for estimation of minimal size (m=mmin) in Passeriformes and non-Passeriformes. See text for explanation.
